This week’s FreightWaves Supply Chain Pricing Power Index: 25 (Shippers)
Last week’s FreightWaves Supply Chain Pricing Power Index: 25 (Shippers)
Three-month FreightWaves Supply Chain Pricing Power Index Outlook: 30 (Shippers)
The FreightWaves Supply Chain Pricing Power Index uses the analytics and data in FreightWaves SONAR to analyze the market and estimate the negotiating power for rates between shippers and carriers.
This week’s Pricing Power Index is based on the following indicators:
Freight recession makes itself known
First of all, I would like to extend an apology to all two of those who read this column faithfully for its absence over the past two weeks. Luckily, market conditions in the trucking industry have not changed considerably.
Unfortunately, the same can be said again. Volumes are just beginning to tick up at the tail end of April, but freight demand in the quarter has been mostly flat and thus grossly unseasonable. Since the produce season was rocked by severe winter storms and flooding in California, this lack of seasonality is somewhat to be expected.
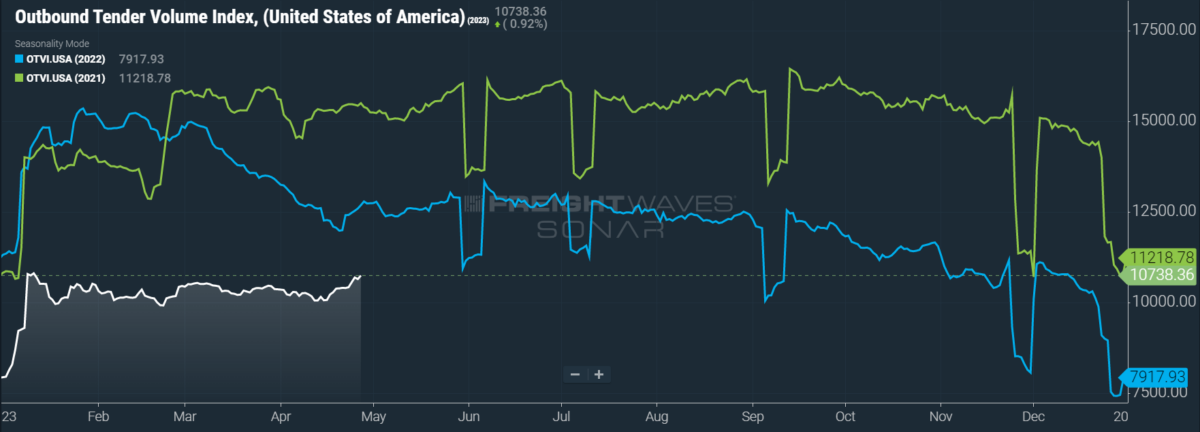
SONAR: OTVI.USA: 2023 (white), 2022 (blue) and 2021 (green)
To learn more about FreightWaves SONAR, click here.
This week, the Outbound Tender Volume Index (OTVI), which measures national freight demand by shippers’ requests for capacity, rose 3.42% on a week-over-week (w/w) basis. On a year-over-year (y/y) basis, OTVI is down 16%, although such y/y comparisons can be colored by significant shifts in tender rejections. OTVI, which includes both accepted and rejected tenders, can be artificially inflated by an uptick in the Outbound Tender Reject Index (OTRI).
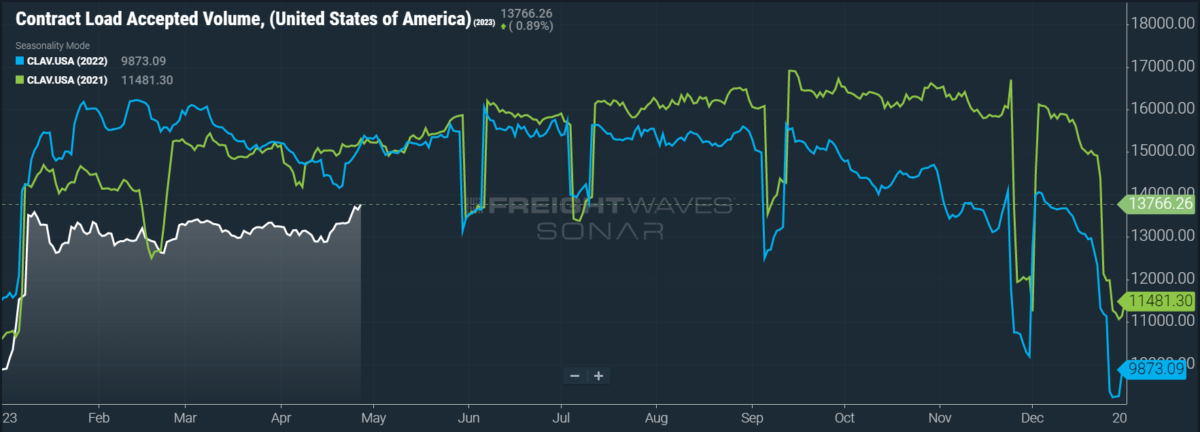
SONAR: CLAV.USA: 2023 (white), 2022 (blue) and 2021 (green)
To learn more about FreightWaves SONAR, click here.
Contract Load Accepted Volumes (CLAV) is an index that measures accepted load volumes moving under contracted agreements. In short, it is similar to OTVI but without the rejected tenders. Looking at accepted tender volumes, we see a rise of 3.41% w/w as well as a fall of 9.4% y/y. This y/y difference confirms that actual cracks in freight demand — and not merely OTRI’s y/y decline — are driving OTVI lower.
The not-so-recent round of earnings calls from major carriers confirmed what our data had been showing for the past year: Namely, weak truckload volumes and a sharp decline in ocean imports, particularly on the West Coast, are forcing the market into a downturn — or, as J.B. Hunt titled it, a “freight recession.” Talking to their customers, carriers widely reported that shippers were continuing to struggle with high inventory levels. Retailers especially expressed uncertainty about consumer activity in the near-term future and had accordingly adopted a cautious stance.
Industry watchers are following suit in this caution. Case in point: Despite some positive signals emanating from the ocean container shipping industry — charter and spot rates have both risen, secondhand ship sales are up, fewer vessels are being sent for demolition — consultancy firm Drewry argues that these movements are just a flash in the pan. Similar to the trucking industry in 2022, capacity is about to flood the market as demand is tapering off.
Although truckload shippers have largely assumed a wariness about how markets could change, some are also reverting back to the standard 12-month contract bid cycle. In 2020-21, when 12-month contracts proved incapable of meeting the shifting balance between supply and demand, shippers began to embrace “mini-bids” that were conducted on a quarterly or even monthly basis. But now that pricing power is firmly in their grasp, shippers are hoping to lock in low rates for a longer period. Yet other shippers are taking the opposite tack, instead working with brokers to stay abreast and take advantage of market lows.
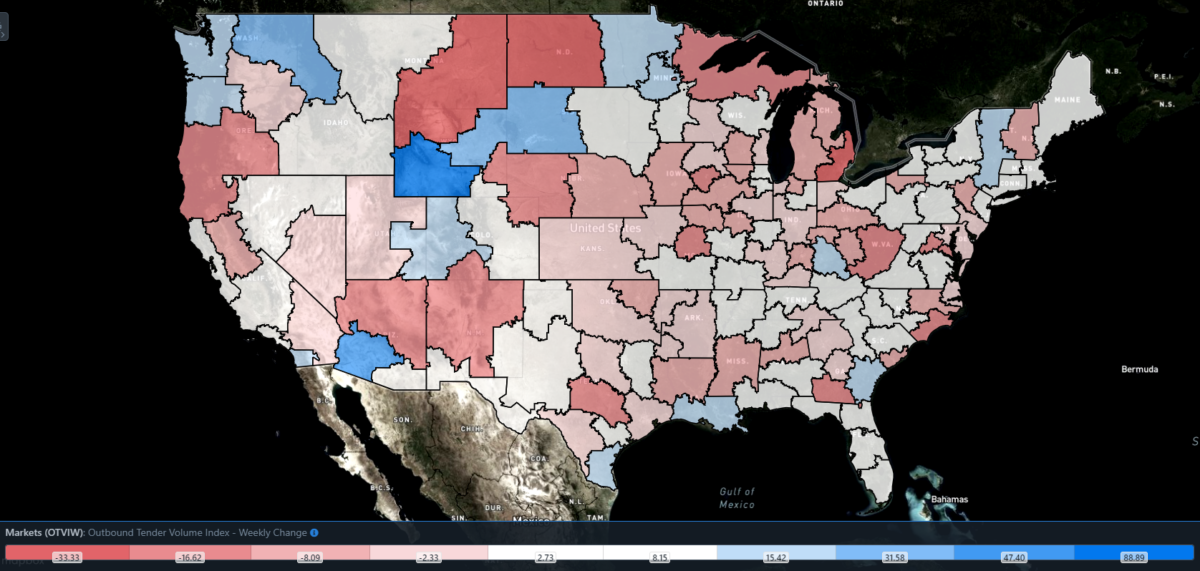
SONAR: Outbound Tender Volume Index – Weekly Change (OTVIW).
To learn more about FreightWaves SONAR, click here.
Of the 135 total markets, 87 reported weekly increases in tender volume, though these gains were largely absent in the most major markets.
Freight demand is heating up in the Arizona market of Phoenix, with the market’s local OTVI rising 47.4% w/w. In late 2021, Gatorade built and occupied a 750,000-square-foot warehouse and distribution center in Phoenix, making it possible that the region’s recent spike in volume is driven in part by a seasonal push to ship the drink ahead of the hot summer months.
By mode: Reefer volumes are unseasonably disappointing, even though the produce season — which begins in Texas and Florida — should be driving reefer demand higher. The Reefer Outbound Tender Volume Index (ROTVI) rose only 1.02% w/w, drastically underperforming against the overall OTVI. As has been mentioned before, produce season will not see any significant gains once California joins the fray, given that the state has suffered disruptive late-winter storms that have reduced the yields on many of California’s crops.
Dry van volumes, on the other hand, are doing quite well, despite obvious sources of upward pressure still absent. The Van Outbound Tender Volume Index (VOTVI) is up 3.93% w/w.
Carriers’ sentiment is in line with market depression
Amazingly, OTRI dropped to new cycle lows over the past three weeks. Although the difference between carriers rejecting 2% or 3% of loads does not matter much in the grand scheme of things, the fact that OTRI can continually find new lows implies that any hope of a near-term recovery must be deferred.
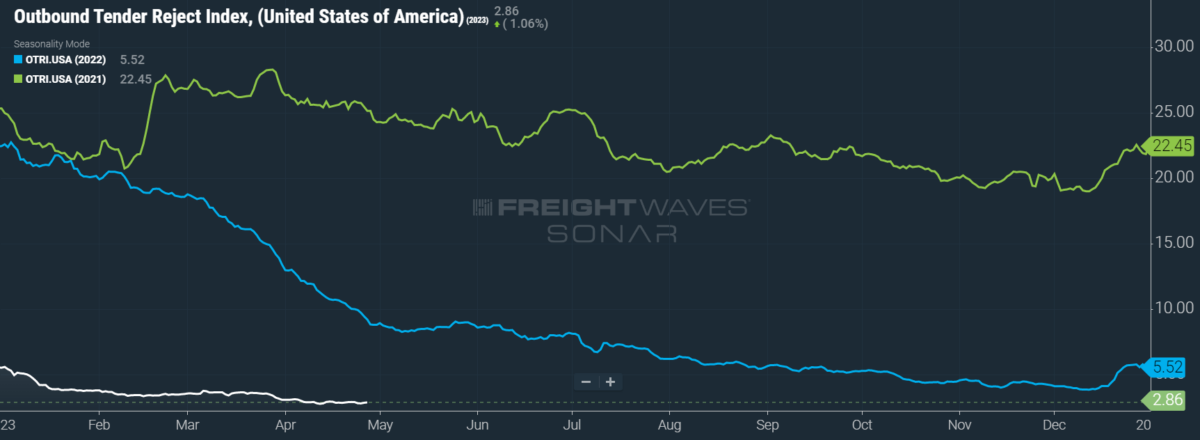
SONAR: OTRI.USA: 2023 (white), 2022 (blue) and 2021 (green)
To learn more about FreightWaves SONAR, click here.
Over the past week, OTRI, which measures relative capacity in the market, rose to 2.86%, a change of 1 basis point (bp) from the week prior. OTRI is now 634 bps below year-ago levels, putting it closer than ever to its pandemic-induced floor.
The Q2 results of FreightWaves’ Freight Sentiment Indexes are in and are painting a pretty ugly picture. A string of bankruptcies and layoffs during the past few months has rattled optimism in the current quarter. Expectations for near-term profitability among carriers are sharply negative, while the slightly positive beliefs in long-term profitability should be taken with a grain of salt: Most people assume that conditions will improve in a year’s time when current circumstances are this dire.
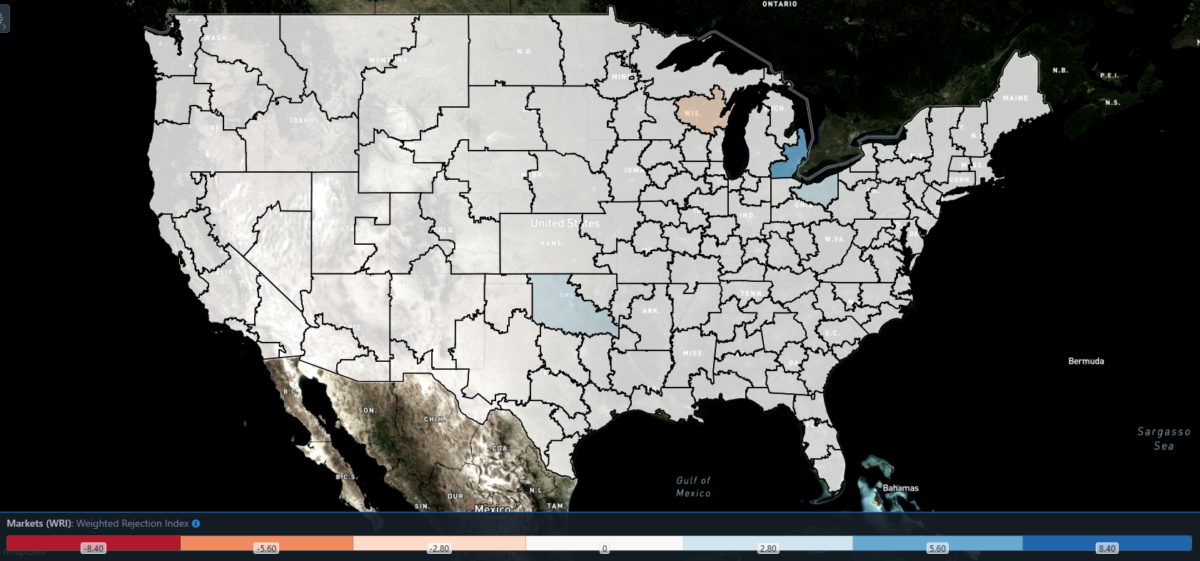
SONAR: WRI (color)
To learn more about FreightWaves SONAR, click here.
The map above shows the Weighted Rejection Index (WRI), the product of the Outbound Tender Reject Index — Weekly Change and Outbound Tender Market Share, as a way to prioritize rejection rate changes. As capacity is generally finding freight this week, a few regions posted blue markets, which are usually the ones to focus on.
Of the 135 markets, 57 reported higher rejection rates over the past week, though 32 of those saw increases of only 100 or fewer bps.
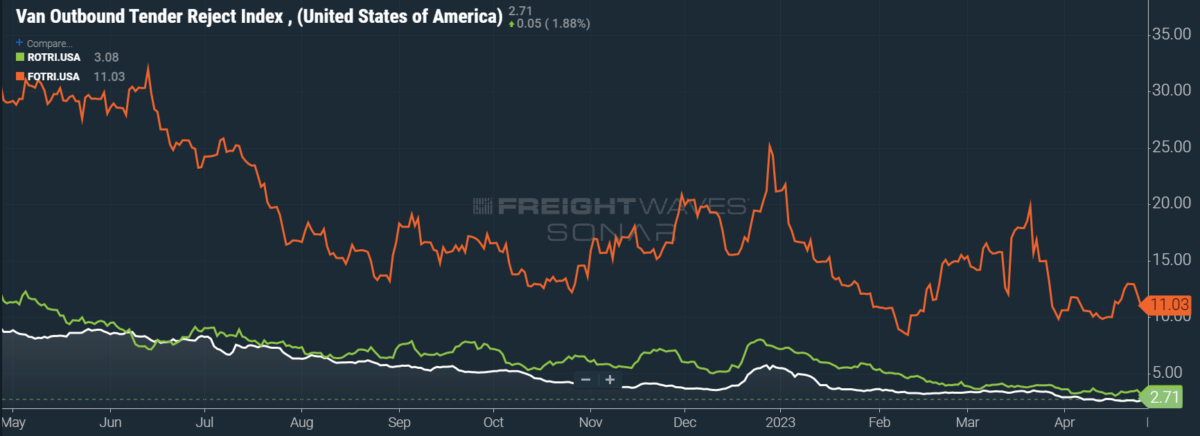
To learn more about FreightWaves SONAR, click here.
By mode: After dropping to 2.53% on Monday, the Van Outbound Tender Reject Index (VOTRI) was the only mode to see gains this week. VOTRI ticked up 13 bps w/w, hitting 2.71%. Flatbed rejection rates, though maintaining a level in the double digits, continue to betray weakness in the sector. The Flatbed Outbound Tender Reject Index (FOTRI) tumbled 148 bps w/w to 11.03%. Finally, the Reefer Outbound Tender Reject Index (ROTRI) — as should be expected from ROTVI’s poor performance — fell 24 bps w/w to 3.08%.
Diesel prices at a crossroads
Amid the volatility of global oil prices over the past 16 months, the cost of diesel and other distillate fuels has remained relatively sticky. While it is true that diesel prices have been on a steady decline since February, the cost of fuel is expected to rise just in time for the (historically) busy summer travel season. After reacting to the latest round of production cuts from OPEC+, announced in early April, oil is trading 13% above its mid-March lows — even after renewed fears of a banking crisis reared their head this week.
Yet oil prices are not the only determinant on the cost of fuel: Refineries’ capacity and throughput are also significant factors. Last year, China overtook the U.S. as the global leader in refining capacity and is looking for further growth in 2023. China, which had hoped to recoup previous losses in manufacturing output caused by strict pandemic measures, now seems to be pivoting toward fuel exports as it stocks up on discounted Russian oil. This push could not only eat into U.S. refinery margins but also keep diesel costs down in the coming months.
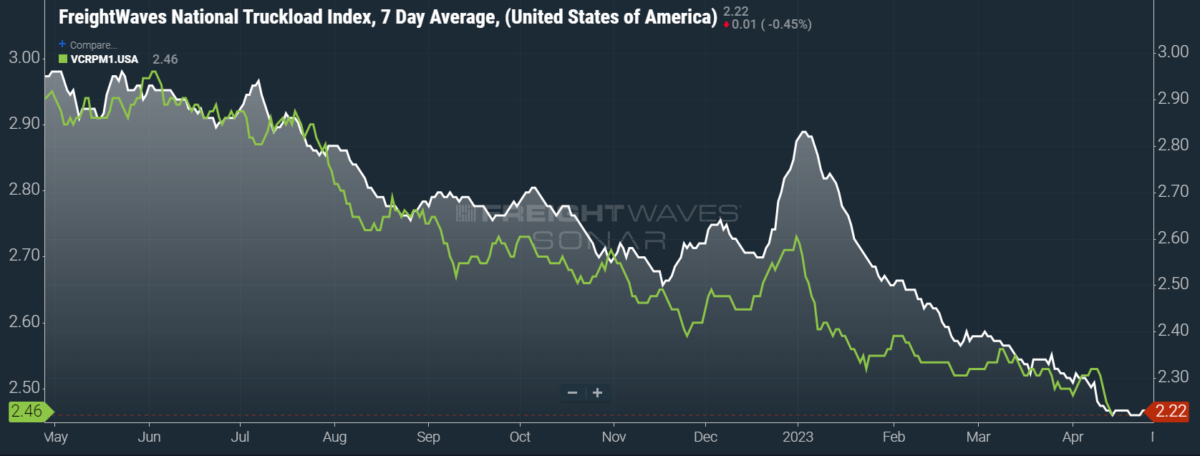
SONAR: National Truckload Index, 7-day average (white; right axis) and dry van contract rate (green; left axis).
To learn more about FreightWaves SONAR, click here.
This week, the National Truckload Index (NTI) — which includes fuel surcharges and other accessorials — held steady at $2.22 per mile. This recent lack of movement might imply that spot rates have found a bottom, though they have found new lows in surprising places before. Linehaul rates were in line with this stability. The linehaul variant of the NTI (NTIL) — which excludes fuel surcharges and other accessorials — remained unchanged at $1.57.
Contract rates, which exclude fuel surcharges and other accessorials like the NTIL, are largely exempt from the drama surrounding diesel prices since fuel costs are often a pass-through for carriers running contracted loads. This week, contract rates fell 7 cents per mile to $2.46. Given that contract rates are reported on a two-week delay, this latest fall likely reflects shippers’ exertion of their pricing power during the Q2 round of contract negotiations.
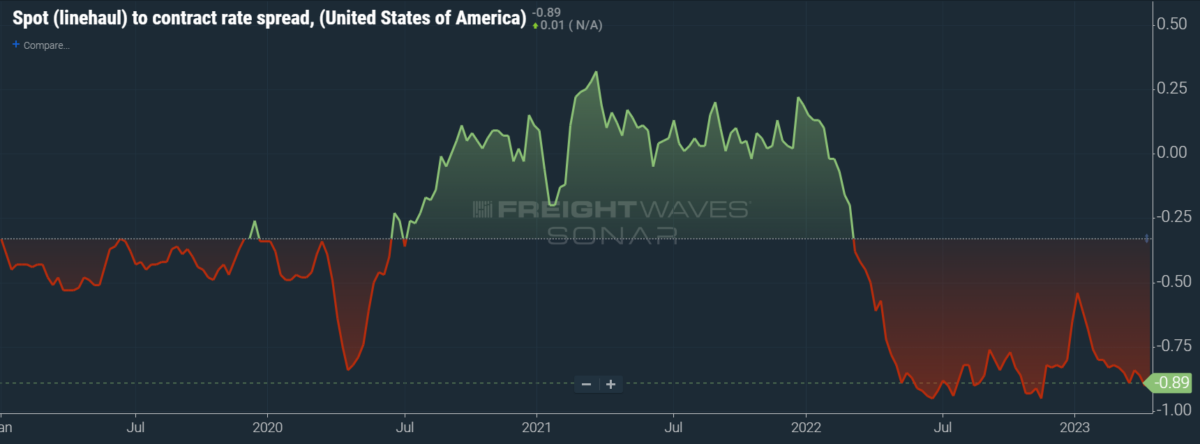
To learn more about FreightWaves SONAR, click here.
The chart above shows the spread between the NTIL and dry van contract rates, revealing the index has fallen to all-time lows in the data set, which dates to early 2019. Throughout that year, contract rates exceeded spot rates, leading to a record number of bankruptcies in the space. Once COVID-19 spread, spot rates reacted quickly, rising to record highs on a seemingly weekly basis, while contract rates slowly crept higher throughout 2021.
Despite this spread narrowing significantly over the first few weeks of the year, tightening by 20 cents per mile in January, it has continued to widen again. Since linehaul spot rates remain 89 cents below contract rates, there is still plenty of room for contract rates to decline over the coming months.
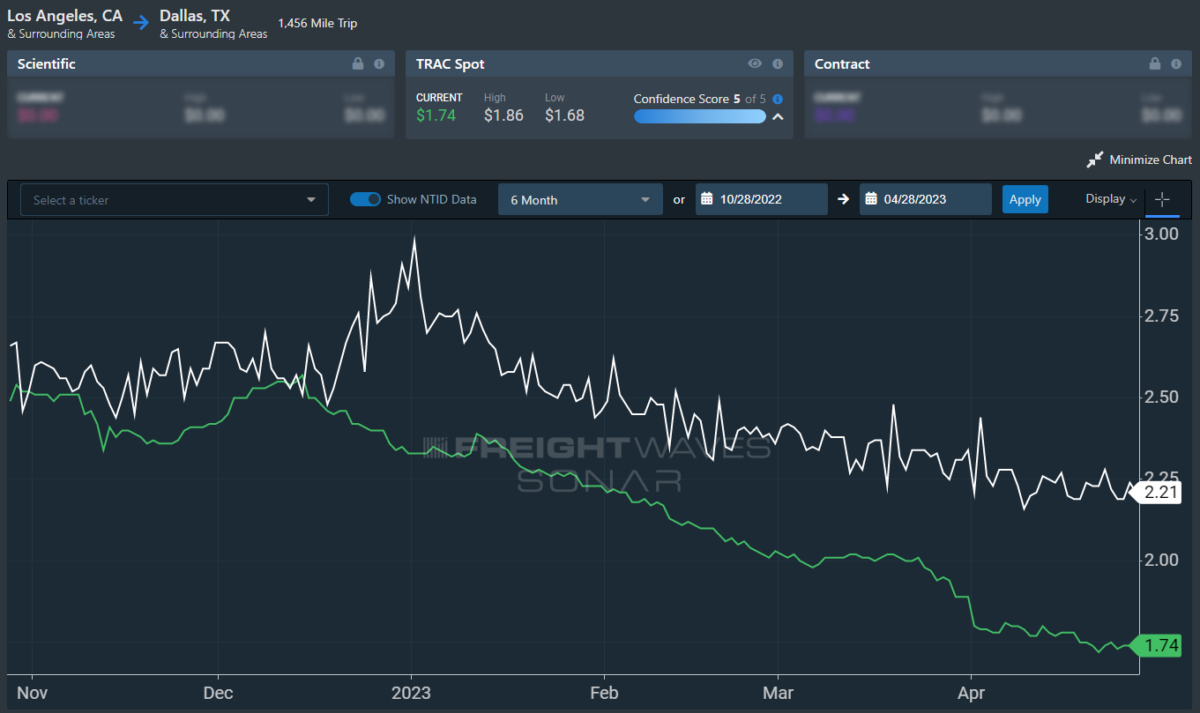
To learn more about FreightWaves TRAC, click here.
The FreightWaves TRAC spot rate from Los Angeles to Dallas, arguably one of the densest freight lanes in the country, has been suffering from minor ups and downs. Over the past week, the TRAC rate remained unchanged at $1.74, a far cry from its year-to-date high of $2.39. The daily NTI (NTID), which sits at $2.21, is handily outpacing rates from Los Angeles to Dallas.
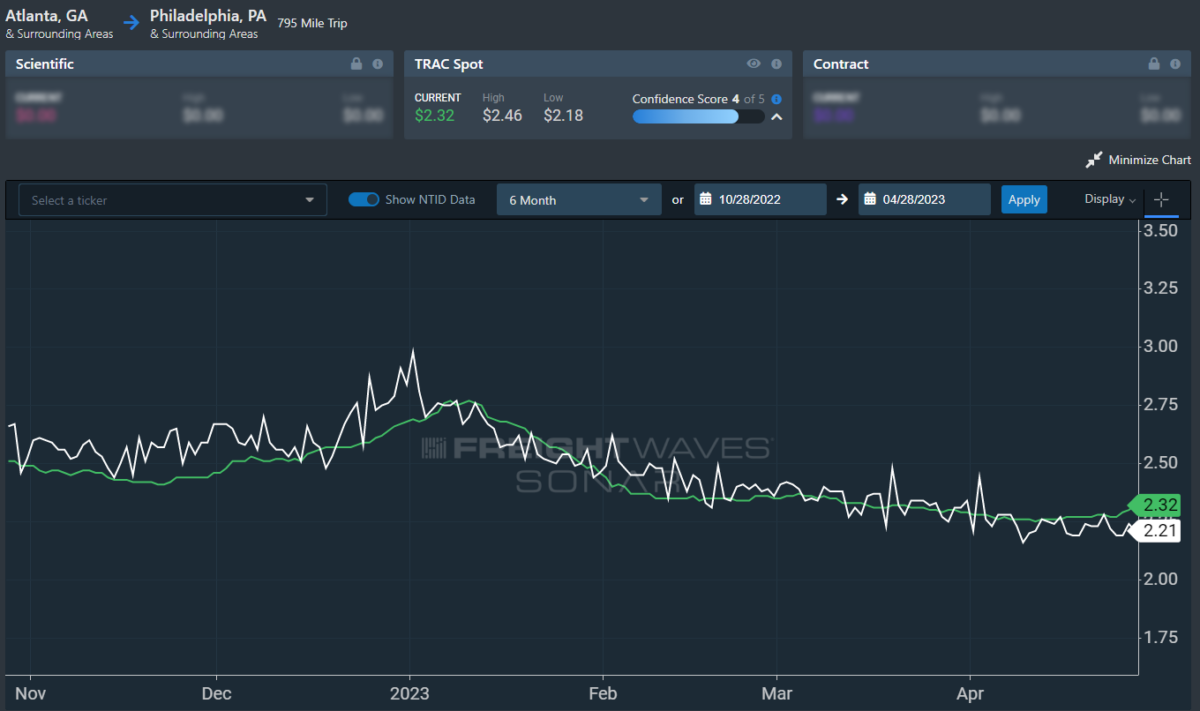
To learn more about FreightWaves TRAC, click here.
On the East Coast, especially out of Atlanta, rates rose to a level that’s outpacing the NTID. The FreightWaves TRAC rate from Atlanta to Philadelphia rose 5 cents per mile w/w to $2.32. Except for Q4’s holiday run and the current reversal, rates along this lane have been dropping stepwise since July 2022, when the TRAC rate was $3.48 per mile.
For more information on FreightWaves’ research, please contact Michael Rudolph at [email protected] or Tony Mulvey at [email protected].


