


Last week, we warned that the “peak” of peak season had already arrived for U.S. containerized import volumes and that demand was likely to decline from here to reach a “new” bottom in the back half of this year (forecasting a 10%-20% decline below second-half, 2019 levels). While container volumes from all ports of origin around the world were peaking last week, container volumes from Chinese ports specifically actually peaked this week. So when trying to understand how these changes in demand are likely to impact container spot rates on the trans-Pacific eastbound, it is important to look at China to the U.S. in isolation.
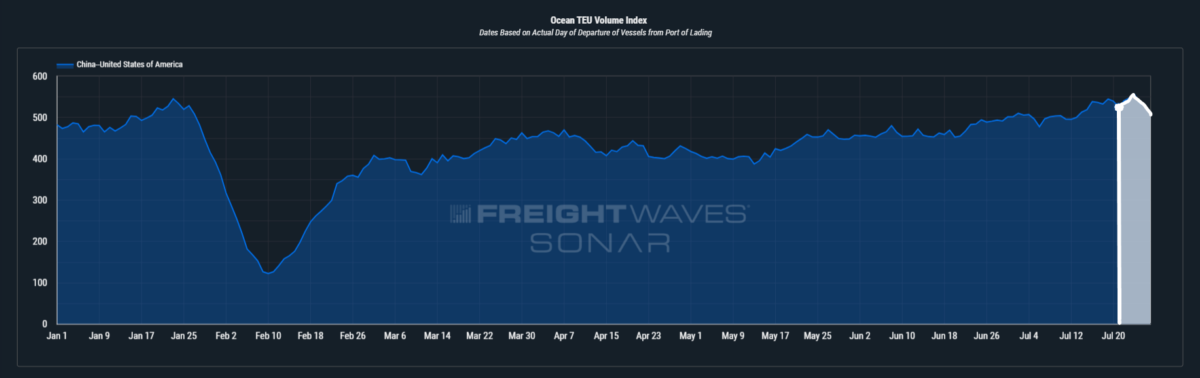
SONAR’s Container Atlas, which provides real-time, high-frequency ocean container data, currently shows FreightWaves’ proprietary Ocean TEU Volume Index (in the chart above) registering a new post-Chinese New Year high for U.S.-bound container volumes departing from all Chinese ports, with volumes set to peak in the next week. While this may be good news for carriers in the short term, as it helps put upward pressure on spot rates, this peak in volume (and thus, any upward pressure on spot rates) is forecast to be short-lived when looking at our Booking Volume Index in the chart below.
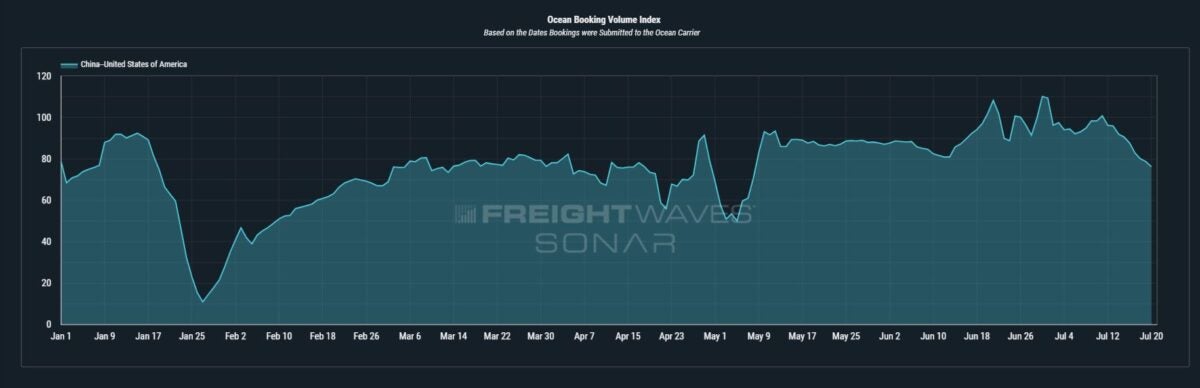
Since the Bookings Volume Index measures container volumes on the date that they are booked and confirmed (allocated a departure date) with ocean carriers, we can better anticipate what future demand will look like by measuring U.S. containerized import volumes up to an additional two to three weeks (on average) in advance of their estimated departure date (date measured by the Ocean TEU Volume Index). As we can see, the Bookings Index is clearly signaling that there is significantly less containerized volume being booked from Chinese ports to the U.S., which means that after the next week when China to U.S. volumes are expected to peak, that volume will begin a downward trend that is likely to persist through a majority of the remainder of 2023.
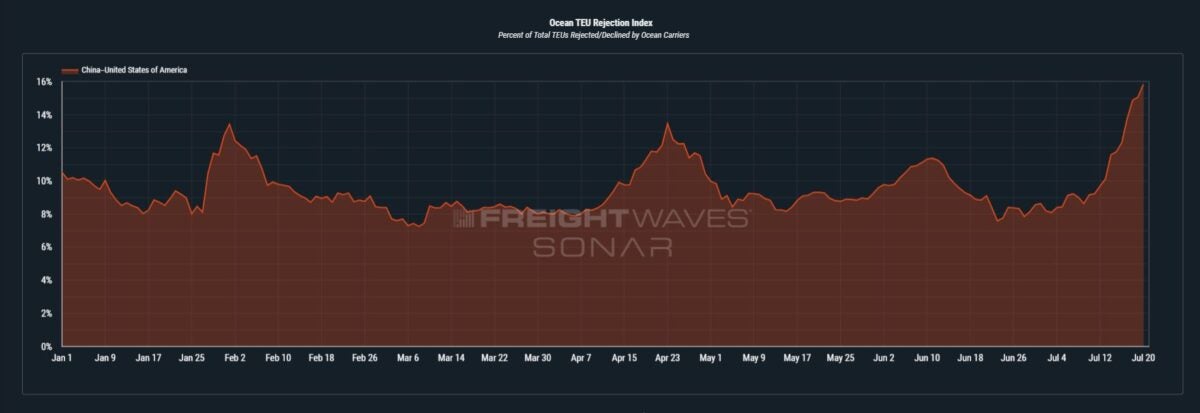
Alongside the Ocean TEU Volume Index set to reach its peak within the next week, the Ocean TEU Rejection Index (in the chart above) is also likely to peak for 2023 in the week ahead. The rejection index is already at its highest point all year with 15.8% of container volumes being rejected/declined by ocean carriers. Since the Ocean TEU Volume Index’s peak during this peak season is still not enough to exceed volumes reached prior to Chinese New Year (when rejections totaled 13.4%), we do not expect the new year-to-date high in rejections to add significantly more upward pressure to spot rates. While this important point does highlight a nuance around ocean carriers’ ability to meaningfully increase spot rates in the face of deteriorating container demand, it does not mean that ocean carriers are not likely to give trans-Pacific eastbound rates another shot at a general rate increase (GRI) on Aug. 1 in a “last-ditch effort” to increase rates as the inevitable decline in demand begins through the end of 2023.
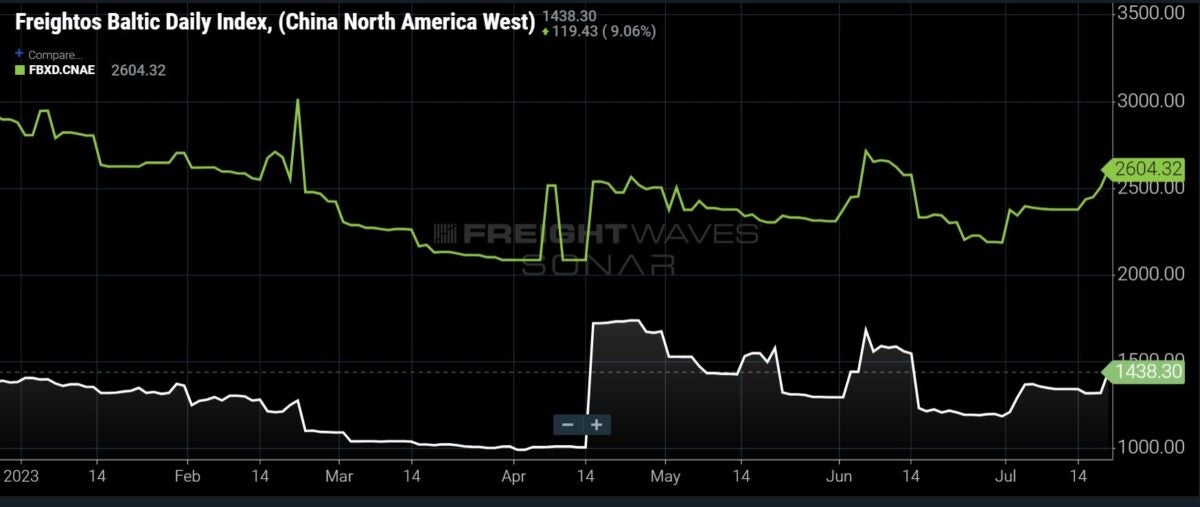
In the chart above, we can already see that the recent increase in TEU rejections has (at least) had a small impact on ocean carriers’ ability to get beneficial cargo owners (BCOs) to accept slightly higher rates, judging by the Freightos Baltic Daily Index from China/East Asia to the North American West (increased 7.2% week over week) and East coasts (increased 9.6% w/w). However, with the Ocean TEU Volume and Bookings Indexes warning that this is the peak of China to U.S. volumes for peak season, while TEU rejections are at year-to-date highs, further highlights that ocean carriers seem to be slowly and steadily losing pricing power and their ability to implement GRIs.
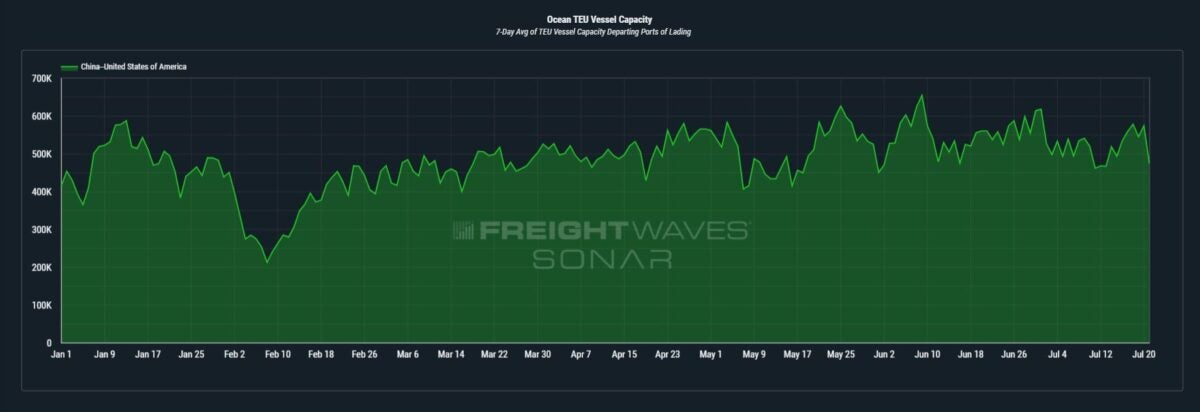
This weakness in ocean carriers’ ability to implement GRIs is also evident when looking at the supply side of the China to U.S. trade lane. As we can see in the chart above, there has been a small decrease in the amount of vessel capacity, which can be attributed to the increased use of canceled sailings, but capacity since Chinese New Year has largely been on an upward trend since March and is also set to increase slightly in the weeks ahead.
These projections highlight the increasing imbalance between supply and demand that is likely to continue to adversely affect ocean carriers’ pricing power as we progress through the back half of 2023. So, it is reasonable to continue expecting that carriers will likely do everything within their power to keep spot rates from falling to their year-to-date lows reached in early April. This includes, but is not limited to, increasing the use and frequency of canceled sailings, scrapping or retiring older vessels from fleets, or choosing to simply idle more vessels until demand experiences a true rebound (likely to occur in 2024).
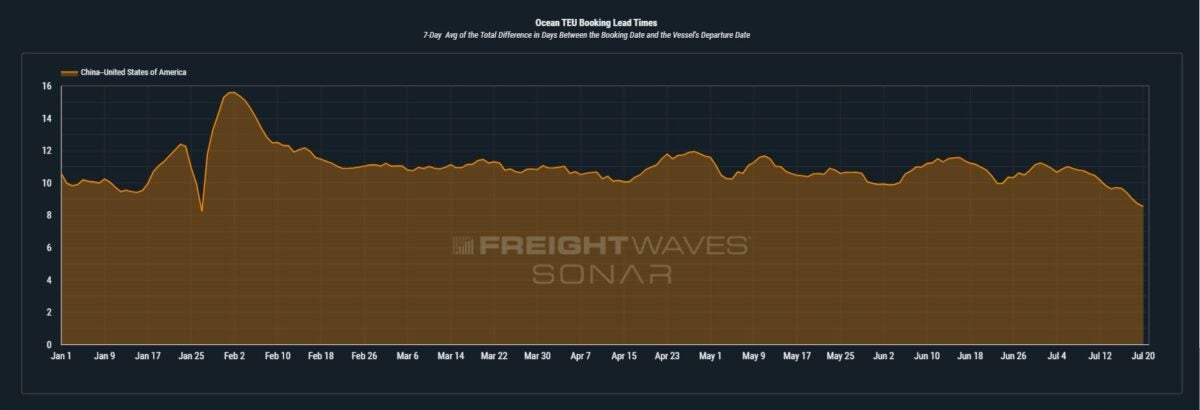
China to the U.S. – Ocean TEU Booking Lead Time (orange). Charts: FreightWaves SONAR Container Atlas. To learn more about Container Atlas, click here.
The recent increase in TEU rejections would also normally cause a shift in lead times from BCOs if they were to be perceiving a prolonged tightening of capacity, but as we can see in SONAR Container Atlas: Booking Lead Times, they are continuing on a downward trend. Also, when looking at current lead times while volumes are peaking (during peak season) from China to the U.S. in comparison to where lead times were during Chinese New Year, we can get a better understanding of the urgency that BCOs have around the volumes that are currently being shipped.
Leading up to Chinese New Year of 2023, while the container market was reverting back to “normal,” BCOs were coming off of years of record-high volatility and thus were used to increasing their lead times by multiple days to help account for those increases in volatility. Fast-forward to present day and it seems as if BCOs are not nearly as concerned about volatility or their ability to get space on a vessel from China to the U.S.