


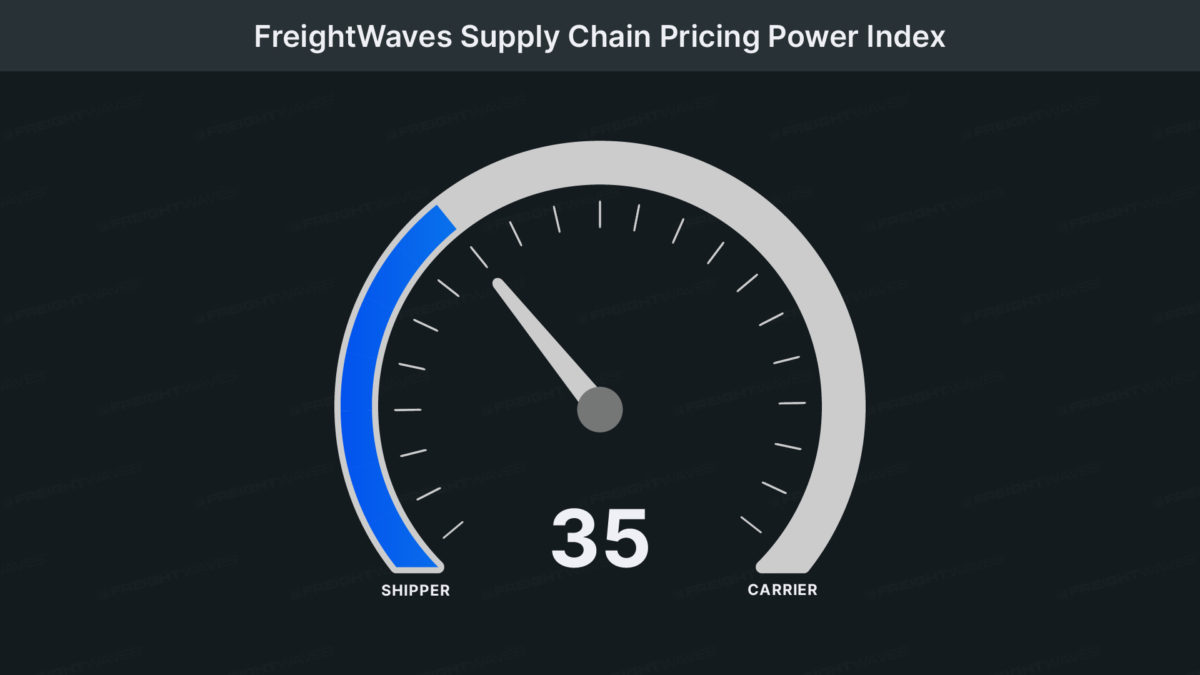
This week’s FreightWaves Supply Chain Pricing Power Index: 35 (Shippers)
Last week’s FreightWaves Supply Chain Pricing Power Index: 35 (Shippers)
Three-month FreightWaves Supply Chain Pricing Power Index Outlook: 35 (Shippers)
The FreightWaves Supply Chain Pricing Power Index uses the analytics and data in FreightWaves SONAR to analyze the market and estimate the negotiating power for rates between shippers and carriers.
This week’s Pricing Power Index is based on the following indicators:
Bulls in a china shop
At the time of writing, December is on track to have a remarkably constant pattern of freight demand. In fact, tender volumes began to outpace 2020 earlier this week and are now marching toward favorable comparisons with 2021, the year of the greatest freight market in recent history. Of course, this robust volume is held primarily within the contract space, meaning that carriers that are mostly exposed to spot freight are not necessarily raking it in.
But this constancy is, in large part, due to the widespread shift among shippers to just-in-time inventory strategies. In other words, should a large amount of capacity suddenly leave the market — say, at the start of next year — those carriers remaining will be well positioned to recoup significant amounts of pricing power.
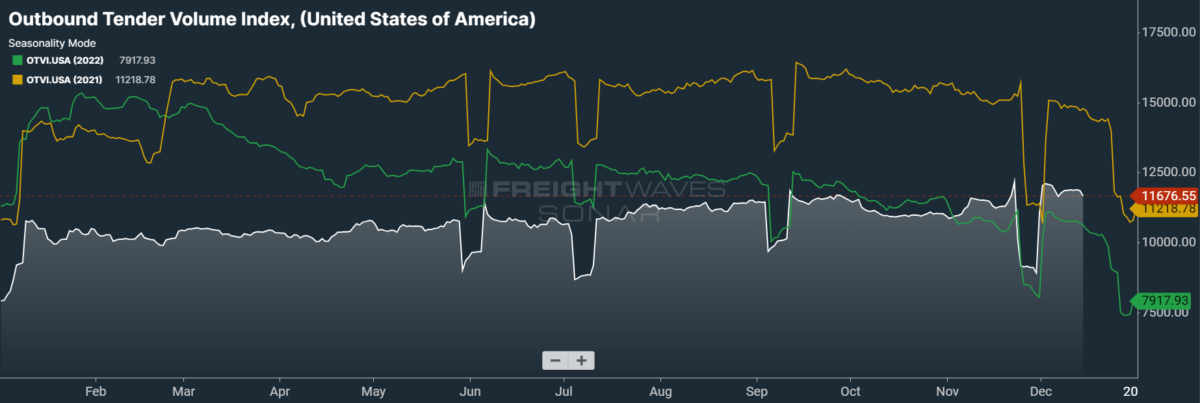
SONAR: OTVI.USA: 2023 (white), 2022 (green) and 2021 (orange)
To learn more about FreightWaves SONAR, click here.
This week, the Outbound Tender Volume Index (OTVI), which measures national freight demand by shippers’ requests for capacity, is up 1.74% week over week (w/w). On a year-over-year (y/y) basis, OTVI is up 11.54%, though such y/y comparisons can be colored by significant shifts in tender rejections. OTVI, which includes both accepted and rejected tenders, can be inflated by an uptick in the Outbound Tender Reject Index (OTRI).
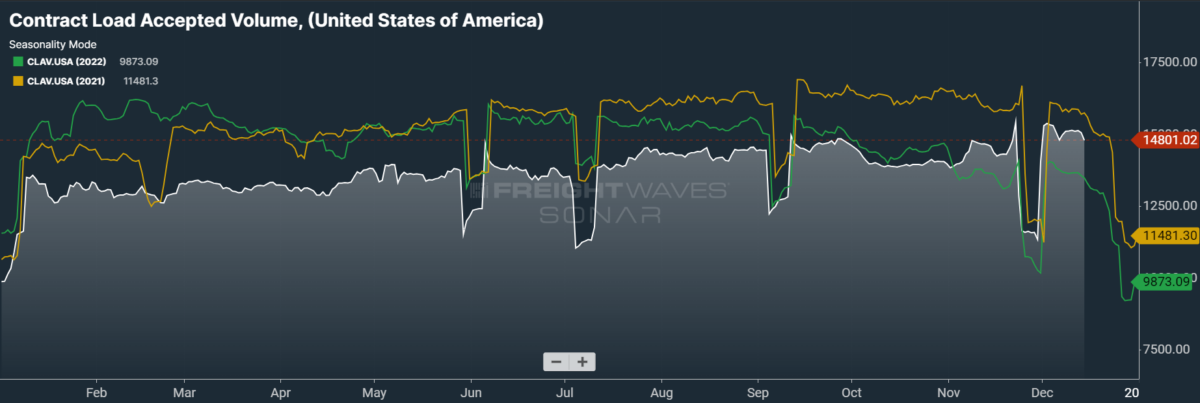
SONAR: CLAV.USA: 2023 (white), 2022 (green) and 2021 (orange)
To learn more about FreightWaves SONAR, click here.
Contract Load Accepted Volume is an index that measures accepted load volumes moving under contracted agreements. In short, it is similar to OTVI but without the rejected tenders. Looking at accepted tender volumes, we see a rise of both 1.7% w/w and of 11.02% y/y. Gaining distance over the previous year implies that actual freight flow is recovering from this cycle’s bottom.
In recent months, I might have been confused for a Federal Reserve cheerleader simply because I was hopeful that the economy could cool without freezing into a recession. But a recent and abrupt pivot in the Fed’s messaging has me removing my pom-poms so that I can instead scratch my head. At the start of the month, Fed Chairman Jerome Powell declared that “it would be premature … to speculate on when policy might ease.” This firm reticence is something we have come to expect from the Fed, which has liked to posture hawkishly even while holding rates steady.
But in remarks made following this week’s meeting of the Federal Open Market Committee — in which the FOMC held rates to no one’s surprise — Powell confessed that rate cuts have begun “to come into view” and that the possibility of cutting rates “clearly is a topic of discussion … for us at our meeting.” For all intents and purposes, Powell might have popped a bottle of bubbly while standing underneath a banner that said “MISSION ACCOMPLISHED.”
While it should be stressed that I am no economist, I similarly believe that rates are due to come down soon before the whole economy grinds to a halt. Yet the question remains: What did the Fed see over a two-week period that made it switch to such a nakedly dovish stance? In this period between reticence and jubilance, there were a few releases: namely, data on the jobs market, supply- and demand-side inflation, consumer sentiment and economic activity in the services sector.
Data from the labor market in November revealed a surprise to the upside, with job gains of 199,000 in the month — both above October’s gain of 150,000 and consensus growth forecasts of 183,000. While these gains were boosted by the return of striking workers from the auto sector and entertainment industry, most analysts agreed that it was a strong report that all but deferred the possibility of a rate cut to Q3 at the earliest. Most importantly, the unemployment rate came in well below expectations, dipping from 3.9% to 3.7% against fears that it would tick up to 4% (and, in so doing, trigger a well-known recession indicator).
Demand-side inflation also reared its ugly head in November, with the Consumer Price Index up a modest 0.1% m/m and 3.1% y/y. The core CPI, which excludes goods with volatile pricing like food and energy, proved a bit stickier as it rose 0.3% m/m and 4% y/y. But the real issue lay with “supercore” inflation, or core services less housing, which has been the Fed’s preferred metric of gauging progress in its fight against inflation this cycle. Not only was the supercore CPI up a concerning 0.5% m/m, but it also inched higher than the critical 4% y/y level.
Per analysis from the Institute of Supply Management, economic activity in the services sector expanded for the 11th consecutive month in November, with almost every surveyed industry noting signs of a nascent recovery. Moreover, the University of Michigan’s Index of Consumer Sentiment surpassed expectations in its December reading, rising to a scorching 69.4 against a consensus forecast of 62.
While the above economic data — again, all of which was released in that two-week period of the Fed’s pivot from hawkishness into dovishness — does not support a pivot in messaging, it did receive positive news about supply-side inflation. November’s release of the Producer Price Index, which tracks inflationary pressures faced by producers across a number of industries, saw the headline index tumble to a gain of only 0.9% y/y, the lowest such rise since June. Even more welcome was the core PPI reading cooler than expected, as it fell to its lowest y/y gain since January 2021.
Nevertheless, there is a real debate to be had whether the single leading indicator of a cooling PPI is substantial enough to counterbalance the hotter-than-expected data from the labor market, consumers’ sentiment and supply-side inflation.
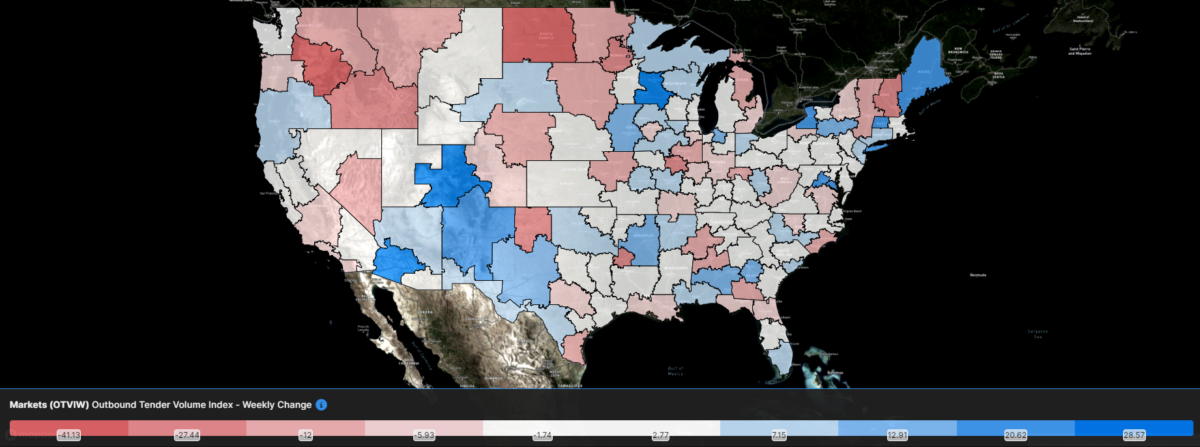
SONAR: Outbound Tender Volume Index – Weekly Change (OTVIW).
To learn more about FreightWaves SONAR, click here.
Of the 135 total markets, 78 reported weekly increases in tender volumes, with many of the gains relegated to the Southwest and Upper Midwest.
US gains influence in oil markets
Oil market analysts are firmly convinced that oversupply will dominate the market in the early months of next year, with some executives labeling the growth in domestic production as “the main reason” why oil prices continue to be so soft. According to the International Energy Agency, the U.S. has accounted for 80% of the expansion in global supply in 2023, with much of the growth occurring in Texas’ and New Mexico’s Permian region. This trend is not expected to reverse any time soon: One executive of a major exploration and production firm forecast that U.S. output could reach 15 million barrels per day within the next five years. For context’s sake, the U.S. produced an average of 13.27 million barrels per day in November.
All said, this news nearly precludes a shock to energy prices this winter, which should keep retail costs of diesel down. More broadly, removing the threat of another round of energy-fueled inflation — which kick-started the current cycle back in February 2022 — bears positively on economic health going forward.
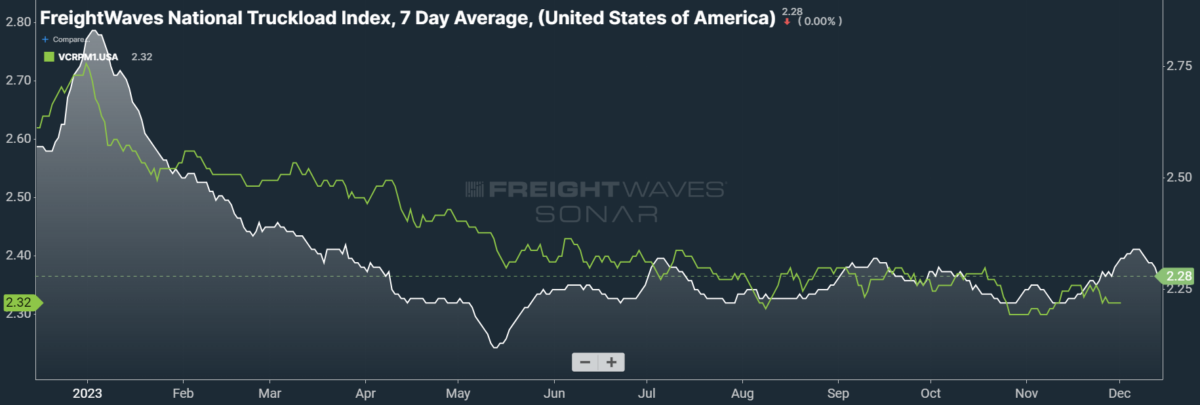
SONAR: National Truckload Index, 7-day average (white; right axis) and dry van contract rate (green; left axis).
To learn more about FreightWaves SONAR, click here.
This week, the National Truckload Index (NTI) — which includes fuel surcharges and other accessorials — fell 6 cents per mile to $2.28. Falling linehaul rates were only partially responsible for this week’s losses, as the linehaul variant of the NTI (NTIL) — which excludes fuel surcharges and other accessorials — fell 4 cents per mile w/w to $1.69.
Contract rates, which are reported on a two-week delay, have lost all of their gains made over Thanksgiving. As contract rate data extends into December, we see a slight decline before the inevitable holiday boost. Bid season is ongoing, however, and shippers still possess plenty of unused pricing power. For the time being, contract rates — which exclude fuel surcharges and other accessorials like the NTIL — are down 2 cents per mile w/w at $2.32.
To learn more about FreightWaves SONAR, click here.
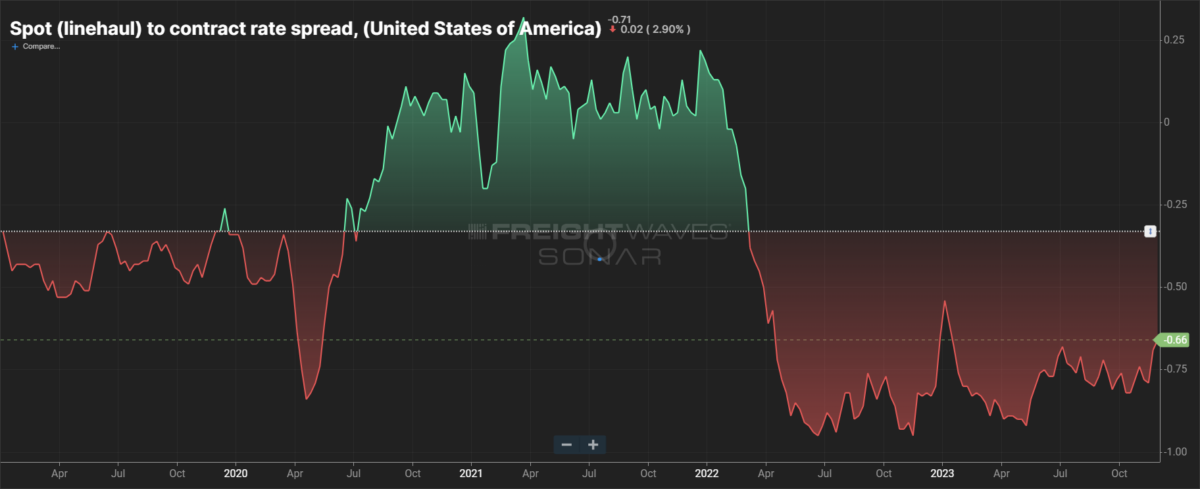
The chart above shows the spread between the NTIL and dry van contract rates, revealing the index has fallen to all-time lows in the data set, which dates to early 2019. Throughout that year, contract rates exceeded spot rates, leading to a record number of bankruptcies in the space. Once COVID-19 spread, spot rates reacted quickly, rising to record highs seemingly weekly, while contract rates slowly crept higher throughout 2021.
Despite this spread narrowing significantly early in the year, tightening by 20 cents per mile in January, it has remained wide throughout most of 2023. As linehaul spot rates remain 66 cents below contract rates, there is plenty of room for contract rates to decline — or for spot rates to rise — in the coming months.
To learn more about FreightWaves TRAC, click here.
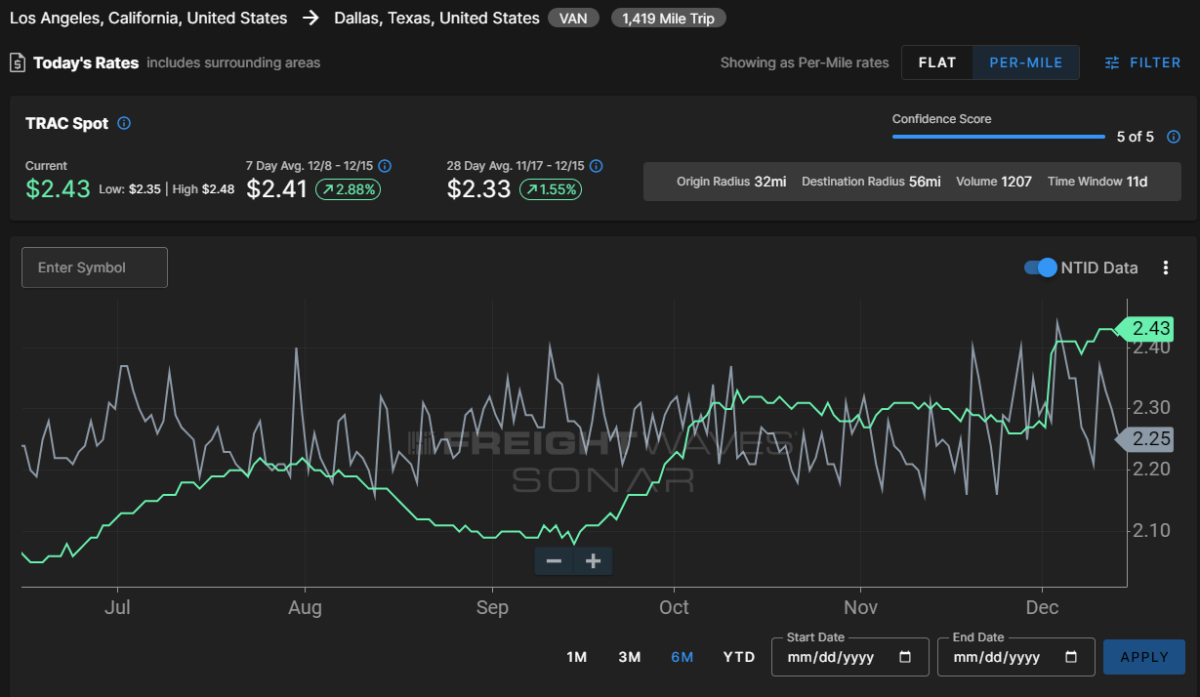
The FreightWaves Trusted Rate Assessment Consortium (TRAC) spot rate from Los Angeles to Dallas, arguably one of the densest freight lanes in the country, continues to benefit from holiday pressure. Over the past week, the TRAC rate rose 4 cents per mile w/w to $2.43 — setting a new year-to-date high. The daily NTI (NTID), which has fallen to $2.25, is again being outpaced by rates along this lane.
To learn more about FreightWaves TRAC, click here.
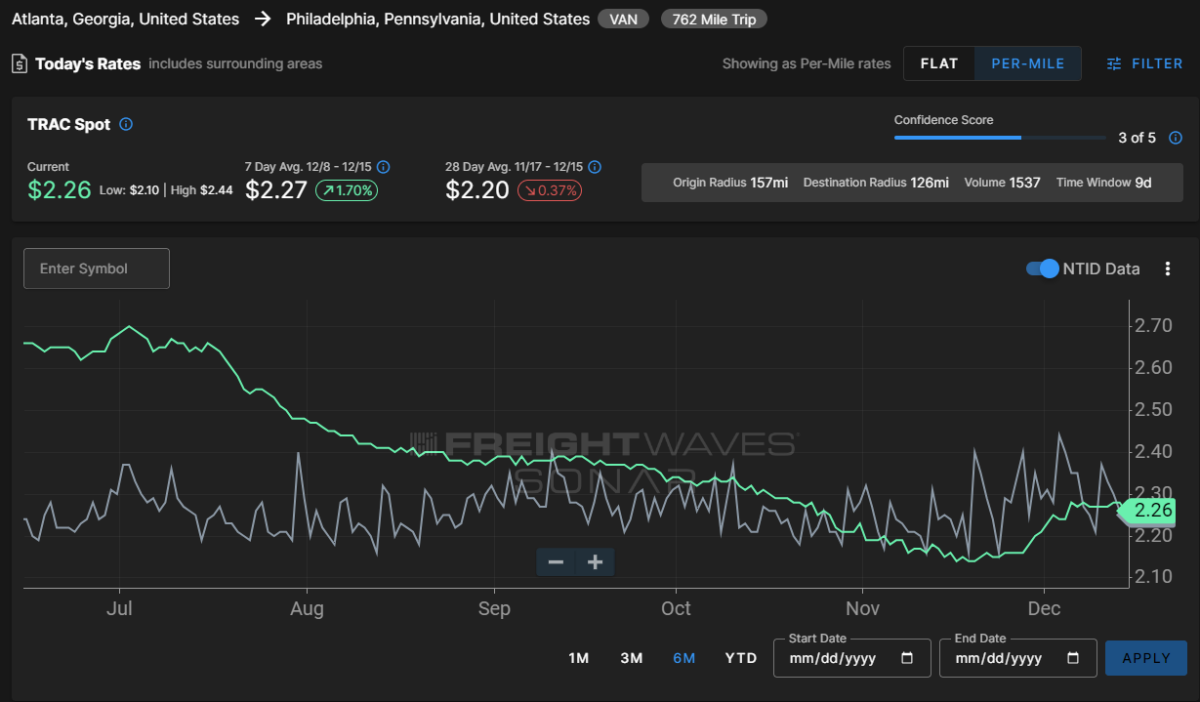
On the East Coast, especially out of Atlanta, rates saw a stark reversal of November’s losses but are still well below their Q3 average. The FreightWaves TRAC rate from Atlanta to Philadelphia fell 2 cents per mile to $2.26. After plateauing well above the national average during the summer, rates along this lane declined sharply at the end of July, lacking any positive momentum until recently.
For more information on FreightWaves’ research, please contact Michael Rudolph at [email protected] or Tony Mulvey at [email protected].
Alex D
More hype to get people excited about nothing.. fools rushed this industry and left the rest of the real carries holding the bill for the greed. I am in it to win. I’m just waiting to rape the hell out of the brokers that have screwed me for the past almost 2 yrs.. payback is a bi$$h
CARLOS 🇺🇸
✅ DECEMBER 2023… Capacity has been decimated by 18 months worth of broker and shipper greed. Expect capacity collapse to continue at least into Q3 2024 ✅🔥🔥🔥
Justthinking
I don’t think Los Angeles to Dallas TX is a good comparison of where the market is at.
Going into Dallas from Los angeles is leaving a decent market into a terrible market in TX
Same goes for ATL > Philly, the lane is always gonna be more expensive because it’s going into the northeast.
I just wish they used a different lane for these examples because these two lanes will always pay better then lets say DALLAS > Los Angeles, Or Philly to ATL.