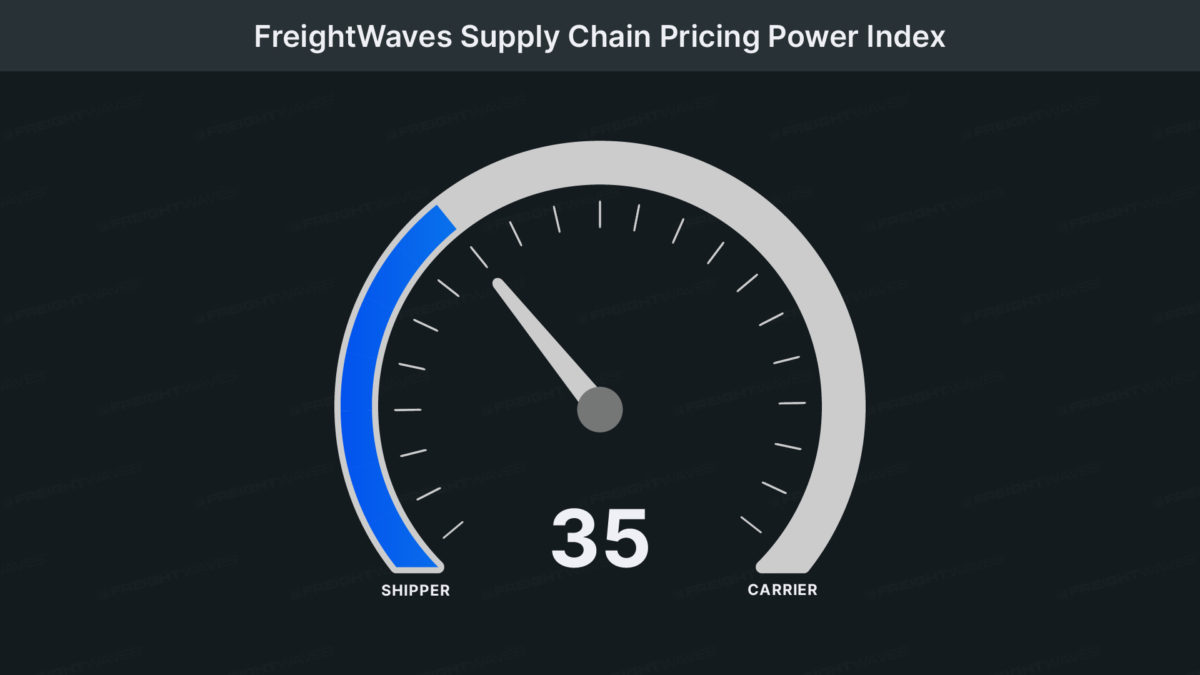
This week’s FreightWaves Supply Chain Pricing Power Index: 35 (Shippers)
Last week’s FreightWaves Supply Chain Pricing Power Index: 40 (Shippers)
Three-month FreightWaves Supply Chain Pricing Power Index Outlook: 30 (Shippers)
The FreightWaves Supply Chain Pricing Power Index uses the analytics and data in FreightWaves SONAR to analyze the market and estimate the negotiating power for rates between shippers and carriers.
This week’s Pricing Power Index is based on the following indicators:
Shippers take a nap before Thanksgiving
Historically, November is the month in which maritime imports begin to move inland for their final push before the holiday shopping season. Yet such imports were lost at sea this year, failing to materialize during ocean shippers’ peak season. This one-two punch of weakened import volumes and overstocked retail inventories means that carriers are left with fewer opportunities to source freight.
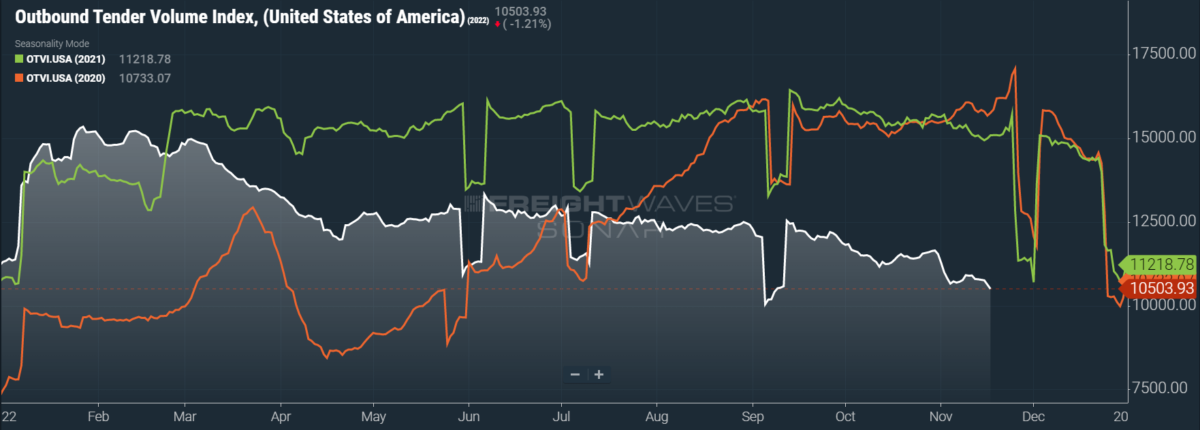
SONAR: OTVI.USA: 2022 (white), 2021 (green) and 2020 (orange)
To learn more about FreightWaves SONAR, click here.
This week, the Outbound Tender Volume Index (OTVI) fell 3.62% on a week-over-week (w/w) basis. On a year-over-year (y/y) basis, OTVI is down 30.43%, although y/y comparisons can be colored by significant movements in tender rejections. OTVI, which includes both accepted and rejected tenders, can be artificially inflated by an uptick in the Outbound Tender Reject Index (OTRI).
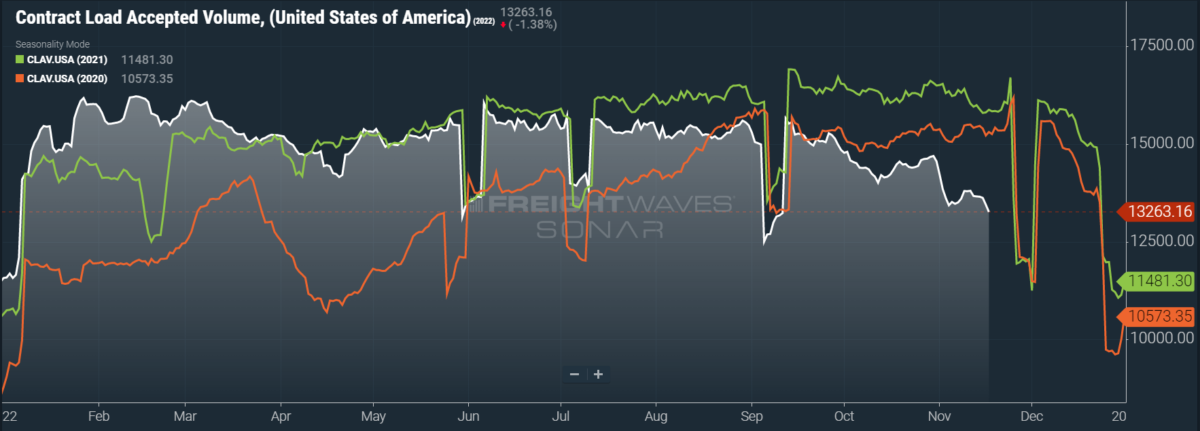
SONAR: CLAV.USA: 2022 (white), 2021 (green) and 2020 (orange)
To learn more about FreightWaves SONAR, click here.
Contract Load Accepted Volume (CLAV) is an index that measures accepted load volumes moving under contracted agreements. In short, it is similar to OTVI but without the rejected tenders. Looking at accepted tender volumes, we see a dip of 3.85% w/w as well as a fall of 16.5% y/y. This y/y difference confirms that actual cracks in freight demand — and not merely OTRI’s y/y decline — are driving OTVI lower.
One of the more alarming signals for near- and long-term freight demand alike is the rapidity with which consumers have racked up credit card debt. When the first few rounds of government stimulus arrived in the early stages of the pandemic, most consumers paid off their revolving credit — which includes credit card debt — and spent the remainder on household goods. Unfortunately, they largely forwent payments on nonrevolving accounts such as student loans and mortgages, given the forbearances that were readily obtainable for these loans.
Yet now, the grace periods are fading for such nonrevolving accounts, which are soon to resume regular payment schedules if they haven’t already. Payment on these accounts alone will eat into consumers’ budgets, disregarding rampant inflationary pressures coupled with relatively sluggish wage growth. Meanwhile, the total amount of credit card debt continues to set all-time highs at the fastest pace on record. Although a wave of credit card delinquencies has yet to surface, delinquency rates on automotive loans have recently hit their highest level in more than a decade, per data from TransUnion.
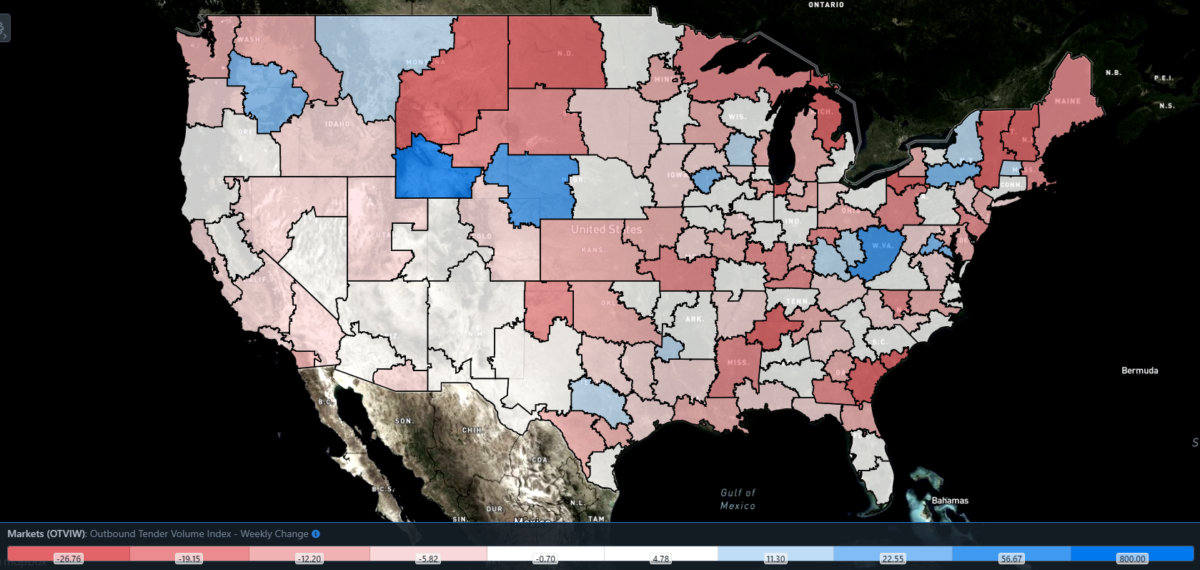
SONAR: Outbound Tender Volume Index – Two-Week Change (OTVIF).
To learn more about FreightWaves SONAR, click here.
Of the 135 total markets, 47 reported weekly increases in tender volume as freight demand flagged across the nation.
Almost all of the heavyweight markets saw slight contraction in line with the overall OTVI’s decline this week. The top three markets by outbound volume — Atlanta, Ontario, California, and Dallas — saw freight demand slide 4.09% w/w, 3.53% w/w and 2.75% w/w, respectively. Two bright spots, on the other hand, were seen in Detroit and Harrisburg, Pennsylvania, which saw tender volumes rise by a respective 3.62% w/w and 2.38% w/w.
By mode: As opposed to the dry van volumes driving losses in the overall OTVI, reefer volumes are inoffensively middling. The Reefer Outbound Tender Volume Index (ROTVI) slid 0.13% w/w, though some of the larger reefer markets — such as Lakeland, Florida, and Pendleton, Oregon — saw considerable gains. The Pendleton market — which encompasses a large swath of Washington state — is responsible for nearly two-thirds of the nation’s apple supply and, according to USDA data, accounts for 78.6% of reefer apple volumes by weight. Accordingly, reefer volumes are up 63.16% w/w in the Pendleton market.
Van volumes are disappointing, with current declines in the Van Outbound Tender Volume Index (VOTVI) traceable to the indelible inventory woes of major retailers. VOTVI is down 3.82% w/w. While VOTVI is down 31.4% y/y, the bulk of this difference stems from rapidly declining tender rejections over that same period. Accepted van volumes are nevertheless down 18% y/y.
Rejection rates dip below 4%
The seal has finally been broken as OTRI, after a month of being bounded between 4% and 5%, fell to 3.99% on Monday. When OTRI is lingering in the low single digits, such milestones are largely symbolic. Truth be told, there is no great difference between 3.99% and 4.01%, especially when compared to the volatility seen in 2021.
But the figures are important when comparing to previous cycles: 2019 saw both an industrywide recession as well as a yearly low of 3.78%, which should be considered OTRI’s floor, pandemic-induced shockwaves aside.
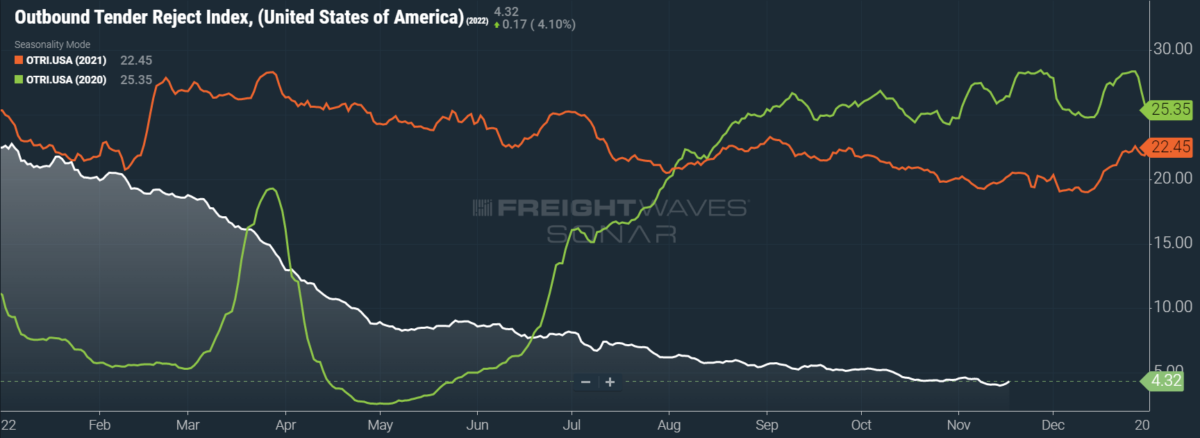
SONAR: OTRI.USA: 2022 (white), 2021 (orange) and 2020 (green)
To learn more about FreightWaves SONAR, click here.
Over the past week, OTRI, which measures relative capacity in the market, did rise to 4.32%, a change of 12 basis points from the week prior. OTRI is now 1,597 bps below year-ago levels.
While many industry watchers breathed sighs of relief after September’s threat of a rail strike was apparently resolved, there is still an opportunity for the labor talks to derail. Three unions — the International Brotherhood of Boilermakers, the Brotherhood of Maintenance of Way Employes Division and the Brotherhood of Railroad Signalmen — have voted not to ratify the labor agreements already on the table. Taken all together, these three unions represent roughly half of the 100,000-plus rail workers involved in the contract talks. These unions are nevertheless prohibited from going on strike until Dec. 9, after which the cooling-off period ends.
The American Chemistry Council (ACC) has relit the fire of urgency behind these talks, warning that any rail strike could plunge the U.S. economy into a full-blown recession. Per the ACC’s estimates, a rail strike lasting even a single month could lead to 700,000 lost jobs over a number of industries, a 4% increase in supply-side inflation, a 1% contraction in gross domestic product and a loss of $160 billion from the economy. While the three aforementioned unions have already voted not to ratify the latest contracts offered, two other rail unions are yet undecided and will announce their votes Monday.
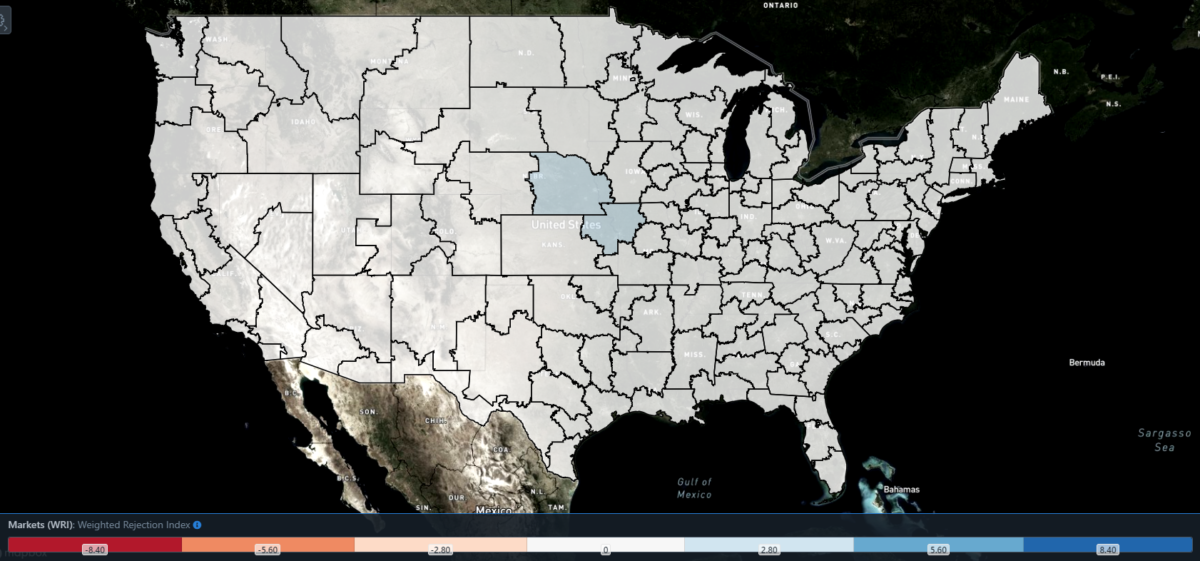
SONAR: WRI (color)
To learn more about FreightWaves SONAR, click here.
The map above shows the Weighted Rejection Index (WRI), the product of the Outbound Tender Reject Index — Weekly Change and Outbound Tender Market Share, as a way to prioritize rejection rate changes. As capacity is generally finding freight, a few regions this week posted blue markets, which are usually the ones to focus on.
Of the 135 markets, 75 reported higher rejection rates over the past week, though 48 of those reported increases of only 100 or fewer bps.
Rejection rates are climbing up in Kansas City, a central node in America’s freight rail network. The Kansas City market saw a huge spike in inbound rail freight recently, reaching its highest level since August. Rejection rates in Kansas City rose 203 bps w/w to 7.93% — roughly double the national average. This latest rise has pushed Kansas City’s local OTRI to heights not seen since July.
To learn more about FreightWaves SONAR, click here.
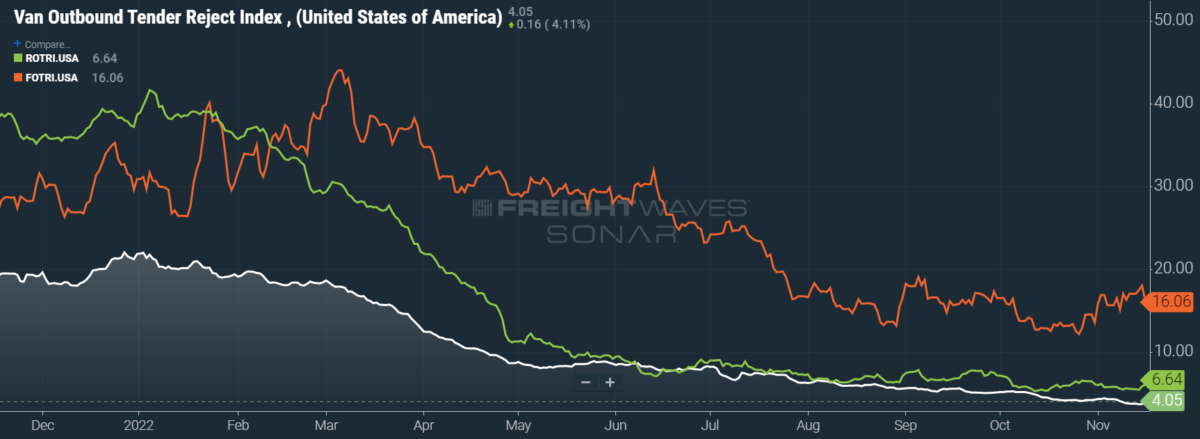
By mode: Flatbed rejection rates have been able to retain their November gains. The Flatbed Outbound Tender Reject Index (FOTRI) reversed the course set in October, when it dipped to a yearly low of 12.21%. While FOTRI did lose 30 bps w/w, it remains near where it began the month at 16.06%. FOTRI has proved to be the most volatile of the three modes, so it is not surprising that it can fluctuate 100 or so bps in a given week. Even still, there are few remaining sources of upward pressure on flatbed rejection rates, since housing starts in October were down 4.2% m/m and 8.8% y/y.
Reefer rejection rates enjoyed a banner week, but it remains unclear whether or not they will, like flatbeds, be able to maintain their stride. The Reefer Outbound Tender Reject Index (ROTRI) swelled 98 bps w/w to 6.64%, creating a little distance from October’s yearly low of 5.31%. Potatoes and apples are driving reefer volumes in the current season, so reefers should enjoy stable volume while it lasts. Van rejections also saw a bounce this week, with the Van Outbound Tender Reject Index (VOTRI) rising 20 bps w/w to 4.05%. This gain, however, is the most likely to be a dead cat bounce, given the abysmal van volumes seen recently.
No brakes on spot rates’ crash
Prices for diesel fuel are topping $6 per gallon in many of the nation’s largest markets by outbound volume, which includes those in California and the Northeast. Compared to gasoline and crude oil, diesel prices across the board have just reached a record-high level. This premium is primarily driven by low stockpiles and refining capacity, and it will likely persist as winter weather spurs higher demand for diesel.
While domestic and global supplies of diesel will almost certainly tighten in response to the upcoming European Union embargoes on Russian crude and products, there is still hope on the horizon. For one, domestic refining capacity should come back online as scheduled repairs at a number of facilities conclude by the end of 2022. Diesel demand is also expected to decline in 2023 as recessionary fears loom large, which should eventually lower prices.
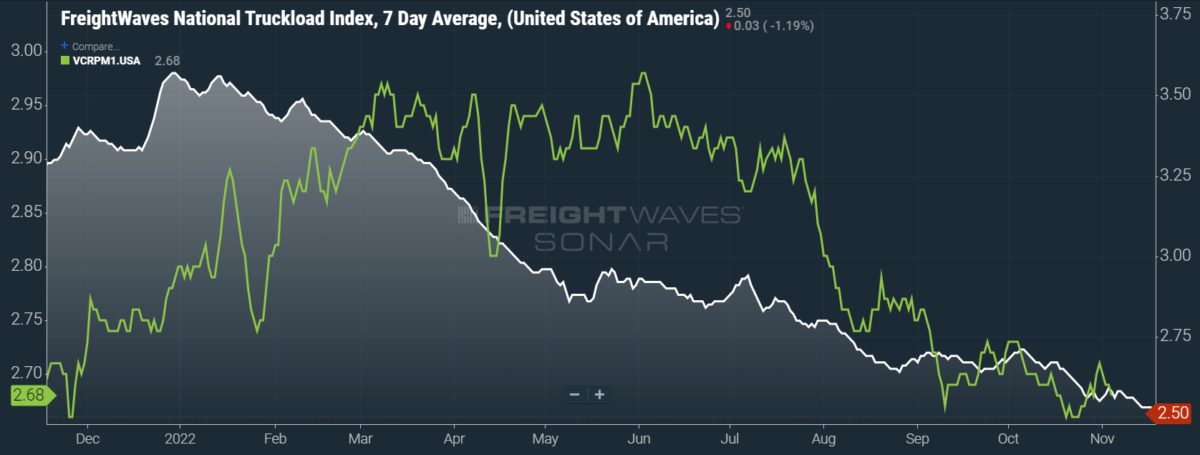
SONAR: National Truckload Index, 7-day average (white; right axis) and dry van contract rate (green; left axis).
To learn more about FreightWaves SONAR, click here.
Yet despite these elevated diesel prices, spot rates are unable to find any upward momentum of their own. This week, the NTI, which includes fuel surcharges and other accessorials, fell 6 cents per mile w/w to $2.50. Since diesel prices began October under $4.85 per gallon and have shot up more than 50 cents since then, continued declines in the NTI are troubling. In fact, it is doubly concerning as the NTI is approaching 2019’s average of $2.06 per mile, a figure that, after adjusting for inflation, approximates $2.41 per mile.
As should be expected, the NTI’s losses can be attributed to weakening linehaul spot rates. The linehaul variant of the NTI (NTIL), which excludes fuel surcharges and other accessorials, similarly fell 6 cents per mile w/w to $1.67.
While not quite having returned to the lows seen in late October, contract rates — which are reported on a two-week delay — are losing their start-of-month bump. This rise and fall of contract rates mirrors the slight gains that spot rates saw in October, which were quickly undone. Contract rates, which exclude fuel surcharges and other accessorials like the NTIL, fell 1 cent per mile w/w to $2.68.
To learn more about FreightWaves SONAR, click here.
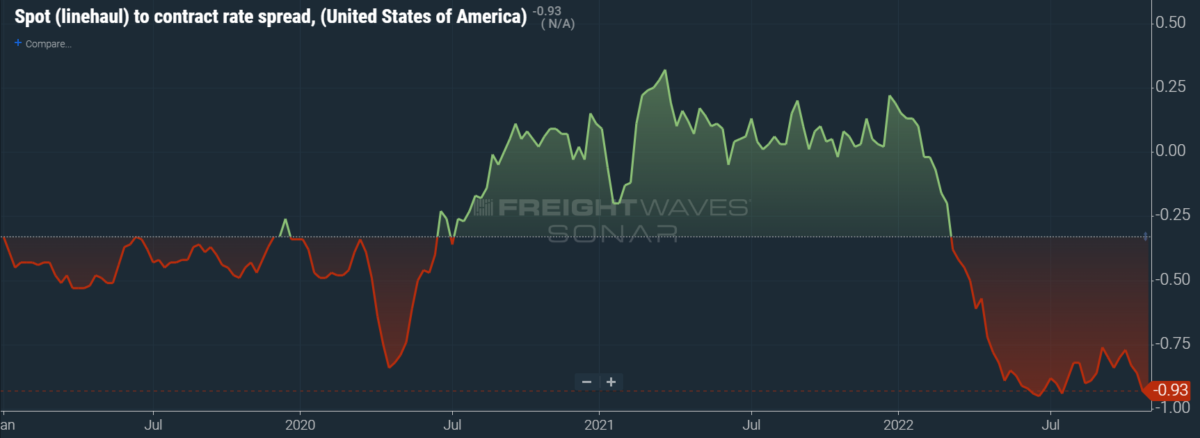
The chart above shows the spread between the NTIL and dry van contract rates, showing the index has continued to fall to all-time lows in the data set, which dates to early 2019. Throughout that year, contract rates exceeded spot rates, leading to a record number of bankruptcies in the space. Once COVID-19 spread, spot rates reacted quickly, rising to record highs on a seemingly weekly basis, while contract rates slowly crept higher throughout 2021.
As the linehaul spot rate remains 93 cents below contract rates, there is still runway for contract rates to decline throughout the next six months.
To learn more about FreightWaves TRAC, click here.
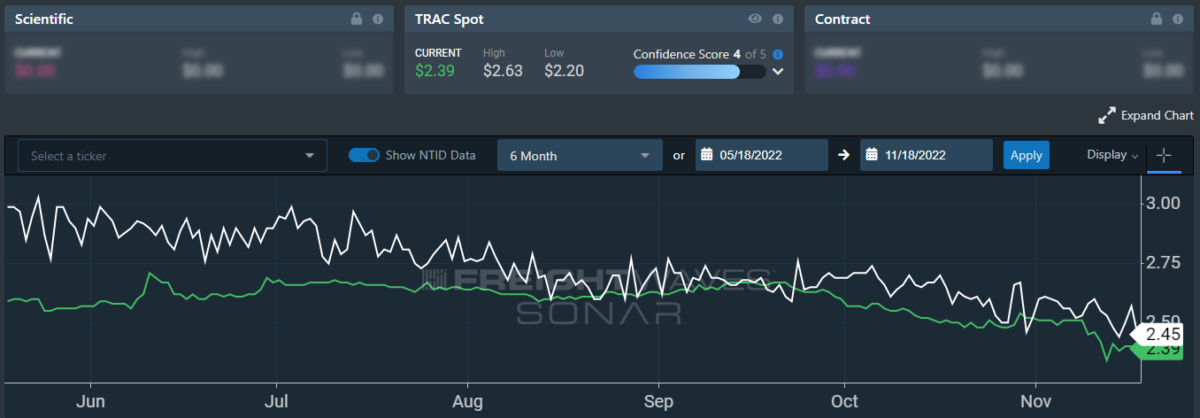
The FreightWaves TRAC spot rate from Los Angeles to Dallas, arguably one of the densest freight lanes in the country, seems close to bottoming out. Over the past week, the TRAC rate fell 7 cents per mile w/w to $2.39. The daily NTI (NTID), which has fallen to $2.45, is nevertheless outpacing rates from Los Angeles to Dallas.
To learn more about FreightWaves TRAC, click here.
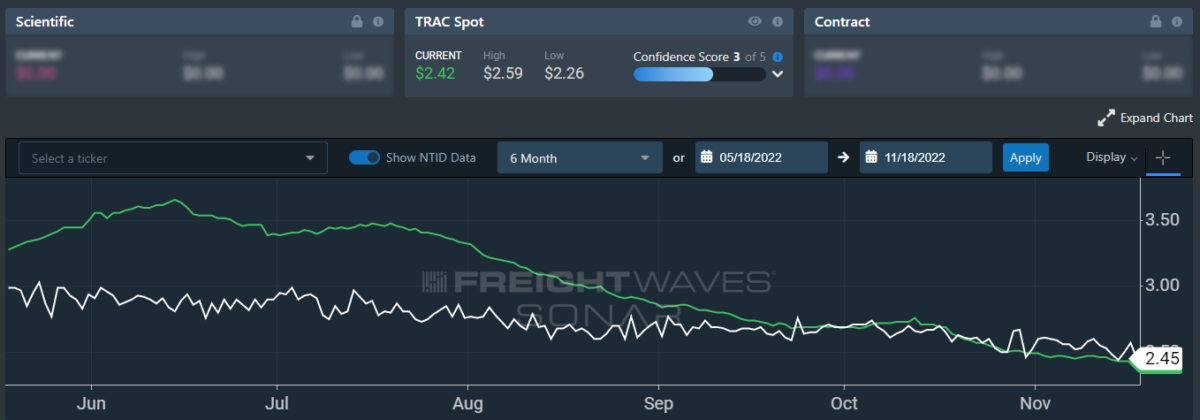
On the East Coast, especially out of Atlanta, rates also fell and are underperforming against the NTID. The FreightWaves TRAC rate from Atlanta to Philadelphia fell 5 cents per mile this week to settle at $2.42. Rates along this lane have been dropping stepwise since mid-July, when the TRAC rate was $3.48 per mile.
For more information on the FreightWaves Passport, please contact Kevin Hill at [email protected], Tony Mulvey at [email protected] or Michael Rudolph at [email protected].


