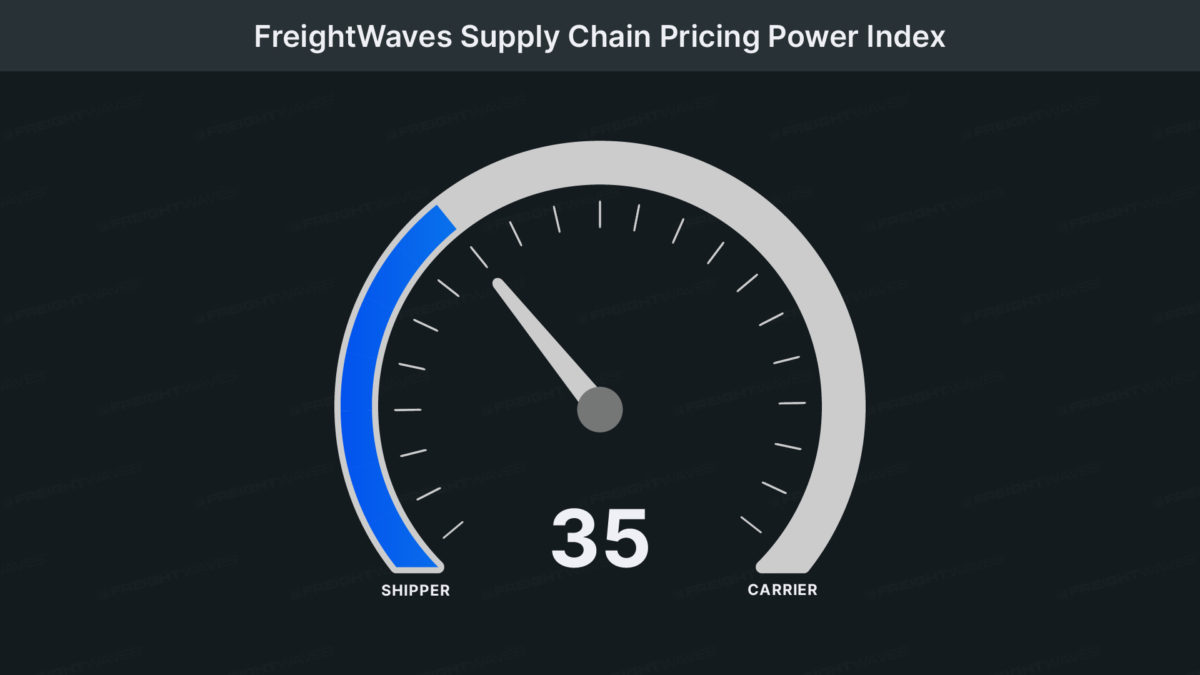
This week’s FreightWaves Supply Chain Pricing Power Index: 35 (Shippers)
Last week’s FreightWaves Supply Chain Pricing Power Index: 35 (Shippers)
Three-month FreightWaves Supply Chain Pricing Power Index Outlook: 30 (Shippers)
The FreightWaves Supply Chain Pricing Power Index uses the analytics and data in FreightWaves SONAR to analyze the market and estimate the negotiating power for rates between shippers and carriers.
This week’s Pricing Power Index is based on the following indicators:
Volumes bounce back from end-of-year slump
Expectedly, freight demand plummeted during December’s holidays, since neither shippers nor carriers wanted to move their loads over the week of Christmas and New Year’s Eve. At present, the Outbound Tender Volume Index (OTVI), which is a seven-day moving average of tendered load volumes, remains depressed due to Monday’s observation of New Year’s Day. Next week, however, volumes should recover from the holiday lull, though the beginning of Q1 is historically a slow and quiet period in the market.
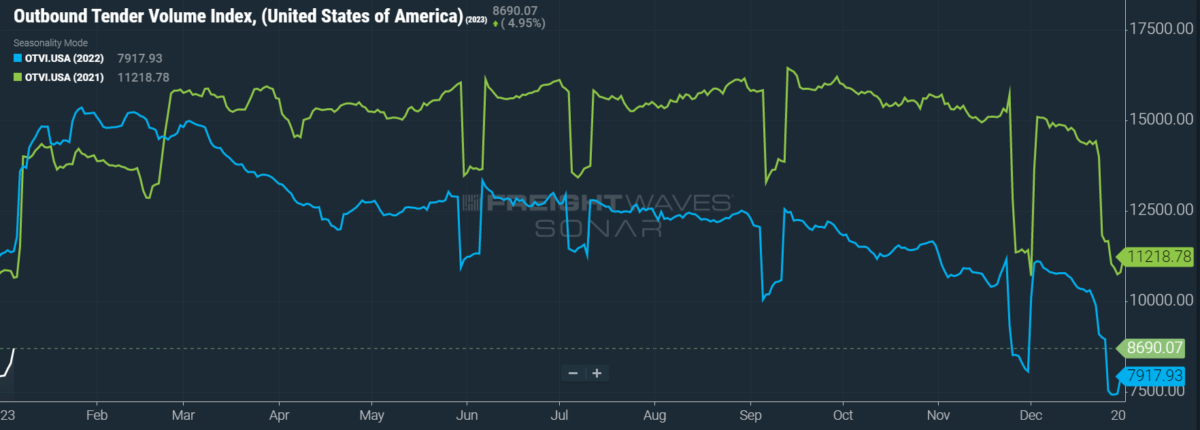
SONAR: OTVI.USA: 2023 (white), 2022 (blue) and 2021 (green)
To learn more about FreightWaves SONAR, click here.
Given the difficulty of comparing one holiday-affected week to another, any of OTVI’s movements on a week-over-week (w/w) basis will not be greatly informative for the time being. Nevertheless, OTVI did rise 16.77% w/w. On a year-over-year (y/y) basis, OTVI is down 26.25%, although such y/y comparisons can be colored by significant shifts in tender rejections. OTVI, which includes both accepted and rejected tenders, can be artificially inflated by an uptick in the Outbound Tender Reject Index (OTRI).
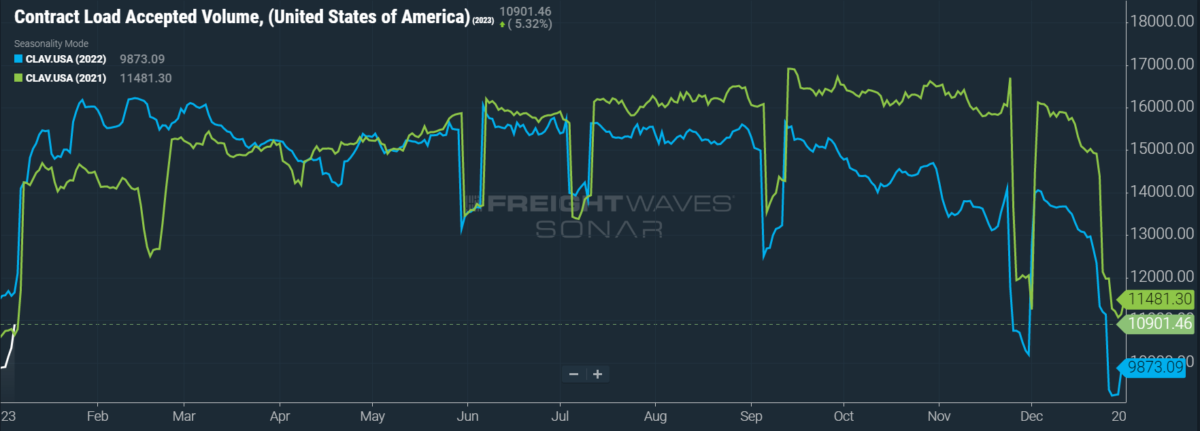
SONAR: CLAV.USA: 2023 (white), 2022 (blue) and 2021 (green)
To learn more about FreightWaves SONAR, click here.
Contract Load Accepted Volumes (CLAV) is an index that measures accepted load volumes moving under contracted agreements. In short, it is similar to OTVI but without the rejected tenders. Looking at accepted tender volumes, we see a rise of 17.8% w/w as well as a fall of 6.4% y/y. While this y/y difference does confirm that actual cracks in freight demand — and not merely OTRI’s y/y decline — are driving OTVI lower, it is worth noting that Q1 2022 was an unusually active season for shippers, which thus makes for unfair comps. At the start of 2022, shippers were just beginning to account for the unforeseen volatility of truckload markets and were eager to secure capacity during the traditionally quiet season of Q1.
In a move that betrays a fear of weakening consumer demand, Amazon announced that it would be laying off more than 18,000 of its employees. This new figure is 80% higher than the 10,000 job cuts that Amazon anticipated in November. The divisions most vulnerable to this move are its devices department — responsible for consumer electronics like its line of streaming devices, its home assistant Alexa and numerous other smart-home products — and its retail team, which oversees various aspects of its e-commerce business that include logistics operations.
Unfortunately for major retailers, leased warehousing space is expected to continue commanding a premium well into 2023, despite aggressive interest rate hikes by the Federal Reserve. Vacancy rates remain at historic lows, thanks in part to the bullwhip effect coupled with an erosion of consumer confidence. Nevertheless, warehousing giant Prologis expects development starts of new warehousing space to decline by 60% in 2023, as costs associated with construction have been impacted by the Fed’s policy changes — not to mention the fact that warehousers have a vested interest in keeping vacancy rates subdued in order to justify future rate increases.
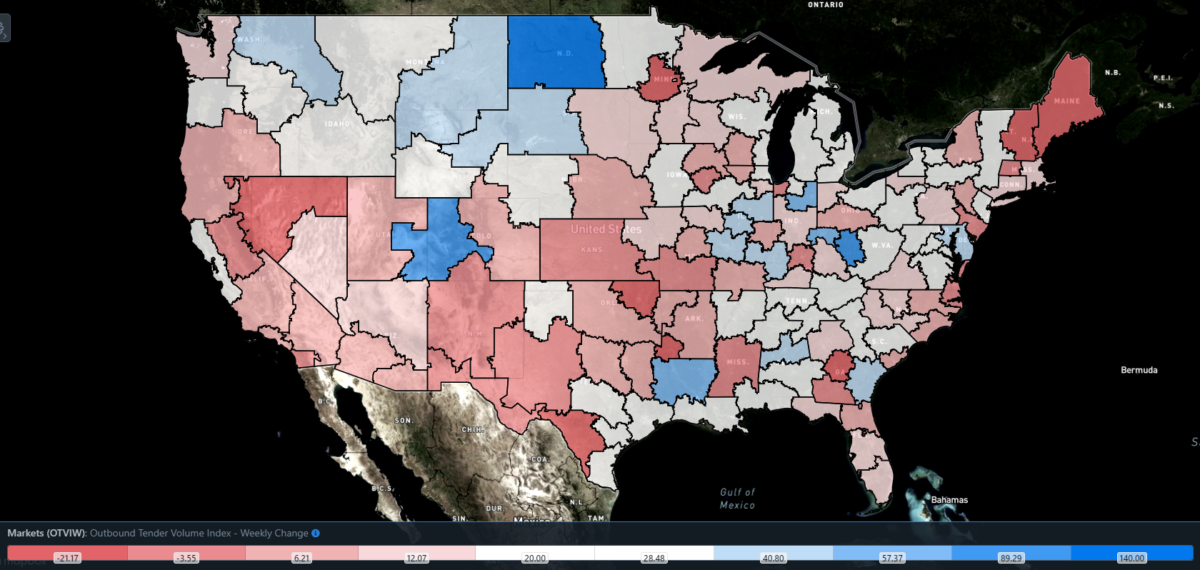
SONAR: Outbound Tender Volume Index – Weekly Change (OTVIW).
To learn more about FreightWaves SONAR, click here.
Of the 135 total markets, 115 reported weekly increases in tender volume as truckload markets rumbled back to life in the new year.
Given the fact that nearly all markets saw freight demand increase over the null week between Christmas and New Year’s, the rate of growth in the heavyweight regions is not terribly informative. However, since the overall OTVI rose 16.77% w/w, we can look at some of the markets that underperformed against it. Such sluggish activity can be found in both the market of Ontario, California — where volumes rose only 10.28% w/w — and in Atlanta, which saw volumes climb a mere 12.1% w/w.
By mode: As I wrote previously in the Daily Watch, a newsletter available for free to all SONAR subscribers, reefers are unlikely to see any notable gains over the coming weeks. True, the Reefer Outbound Tender Volume Index (ROTVI) is still depressed — as are all volume indices — from the holiday lull and should rebound to normalcy next week. But forecasts from the National Oceanic and Atmospheric Administration (NOAA) predict that much of the lower 48 will experience higher-than-average temperatures throughout January.
Compare this expectation against February 2021, when a severe cold wave led many dry van shippers to switch modes, pushing their freight onto reefers so as to insulate it from extreme winter conditions. ROTVI skyrocketed during this period, as reefers typically benefit from drastically cold or abusively hot temperatures. But if NOAA’s prediction for mild January weather should prove accurate, reefers in 2023 will not see such an uptick in demand from these cross-modal shippers. At present, ROTVI is up only 4.41% w/w but is down 33.75% y/y, the latter of which is primarily due to falling tender rejections.
While mild temperatures should spell good news for dry vans, since they won’t be hemorrhaging loads to insulated reefers, the overall depressive environment should continue to blow headwinds against further growth. As with ROTVI, though, the Van Outbound Tender Volume Index (VOTVI) should bounce back next week to stable levels. For the time being, VOTVI is up 18.25% w/w but is down 25.28% y/y.
Rejection rates lose upward momentum rapidly
OTRI saw a sizable boost from the holidays that pushed it close to 6%. But the index is already losing its grasp on those fleeting gains, which is worrying since OTRI (like OTVI) is a seven-day moving average that, at the time of writing, still accounts for both New Year’s Eve and New Year’s Day.
This decline suggests two possible factors that are not mutually exclusive: First, while carriers held the week of Christmas as inviolable, they had little issue with hauling freight soon after the calendar flipped; second, they were desperate to make up for lost time on the road, so the post-holiday OTRI data is low enough to outweigh the holiday average. When the index shakes off the holiday noise, it will be interesting to see how carriers are setting the tone for 2023 with their rejections (or lack thereof).
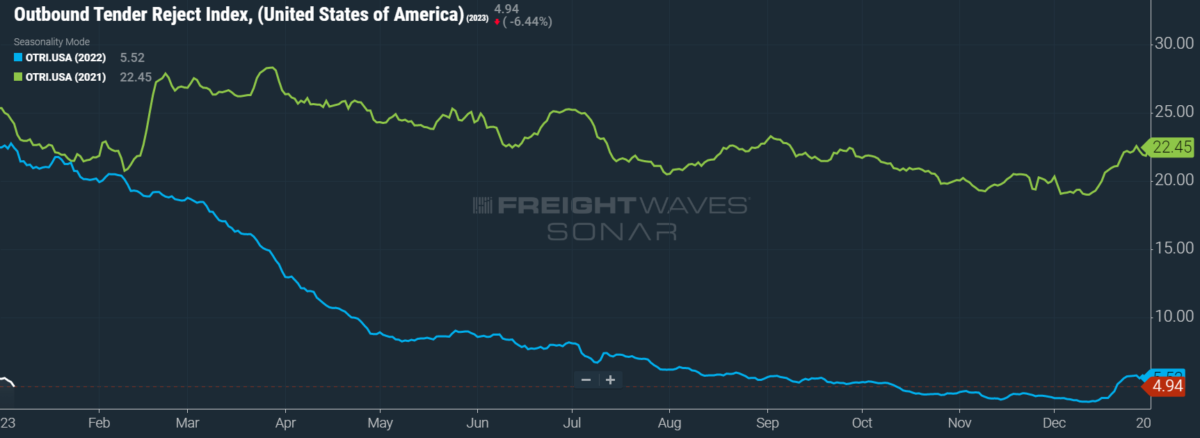
SONAR: OTRI.USA: 2023 (white), 2022 (blue) and 2021 (green)
To learn more about FreightWaves SONAR, click here.
Over the past week, OTRI, which measures relative capacity in the market, fell 83 basis points (bps) to 4.94%. OTRI is now 1,749 bps below year-ago levels.
In response to complaints lodged by the Owner-Operator Independent Drivers Association, the Federal Motor Carrier Safety Administration is taking a harder stance on regulating brokers and freight forwarders. FMCSA has proposed to scrutinize more carefully the liquid assets of brokerages in order to protect carriers from brokers’ nonpayments due to unforeseen insolvency. Per FMCSA’s estimates, 1.3% of brokerages in 2022 failed to pay carriers, with submitted claims averaging $1,700.
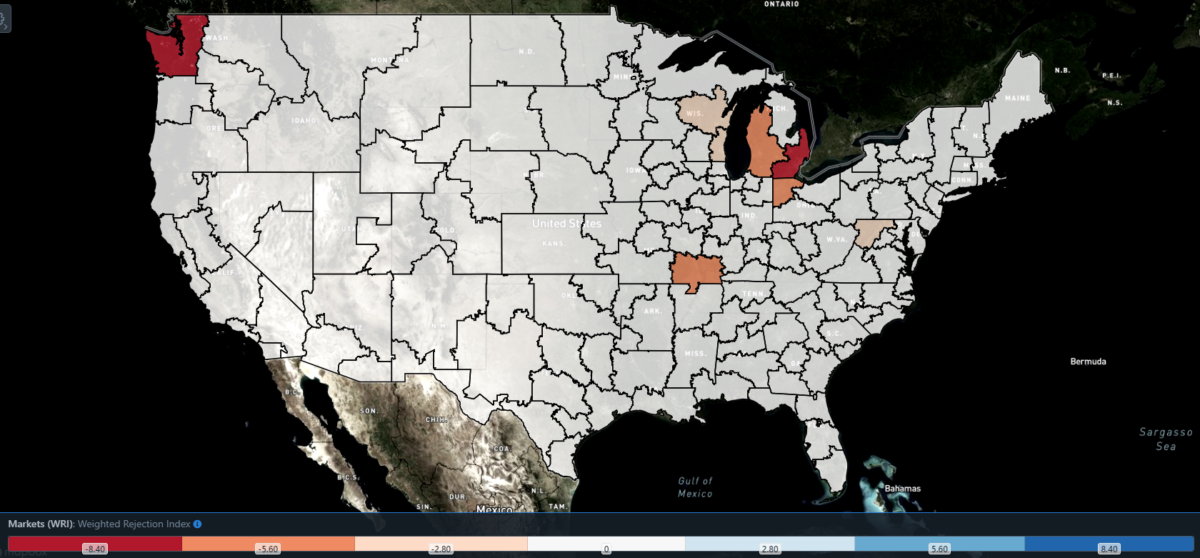
SONAR: WRI (color)
To learn more about FreightWaves SONAR, click here.
The map above shows the Weighted Rejection Index (WRI), the product of the Outbound Tender Reject Index — Weekly Change and Outbound Tender Market Share, as a way to prioritize rejection rate changes. As capacity is generally finding freight, this week no regions posted blue markets, which are usually the ones to focus on.
Of the 135 markets, 47 reported higher rejection rates over the past week, though 28 of those reported increases of only 100 or fewer bps.
Rejection rates in Detroit have been on a wild roller coaster over the past month, with its local OTRI movements being the most volatile among the major markets. During November and most of December, Detroit’s OTRI hovered around 1%, dipping down to 0.92% on Dec. 11. After Christmas and especially New Year’s Eve, however, rejection rates soared to 15.48%. But like the gains seen in the nationwide OTRI, this boost is short-lived. Over the past week, Detroit’s OTRI has already plummeted 725 bps to 6.27% — it would be unsurprising if it fell another 500 bps or so by the end of next week.
To learn more about FreightWaves SONAR, click here.
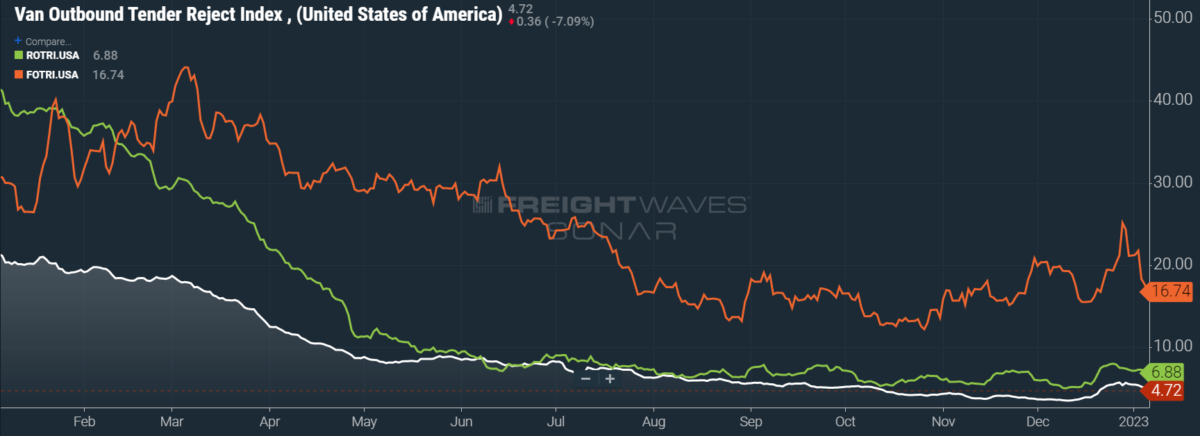
By mode: Volatility in flatbed rejection rates has been something of a constant, as the Flatbed Outbound Tender Reject Index (FOTRI) fell 761 bps w/w from 24.35% to 16.74%. Unless the oil and gas sector sees a flurry of activity in the upcoming months, there are few sources of upward pressure on FOTRI for this first quarter. Construction historically wanes during the colder season, though the current discounts on lumber and other materials might entice builders to strike while the iron is hot.
Reefers have been a bit slower to give up their holiday gains in rejection rates, but the sluggishness seen in reefer volumes should temper the Reefer Outbound Tender Reject Index (ROTRI) before long. At present, ROTRI is only down 54 bps w/w to 6.88% — retaining some distance from December’s low of 5.02%. Dry van rejection rates, meanwhile, are the biggest driver behind trends in the overall OTRI, as the Van Outbound Tender Reject Index (VOTRI) is down 97 bps w/w to 4.72%.
Rising fuel costs could soon weigh on all-in spot rates
Diesel prices are caught in a temporary tug-of-war. On the one hand, the damage caused by Winter Storm Elliott — which gave rise to a truly tragic loss of human lives in Buffalo, New York, and elsewhere — hamstrung refinery capacity, sending the nationwide average diesel price per gallon upward for the first time in seven weeks. (Perhaps more notable to consumers was the spike in gasoline prices, also caused by offline refinery capacity.)
On the other hand, NOAA’s aforementioned forecasts for mild January weather are both decreasing demand for diesel, used as a heating source, as well as making quick repairs to refineries plausible. So long as diesel prices are elevated, however, all-in spot rates will follow in lockstep.
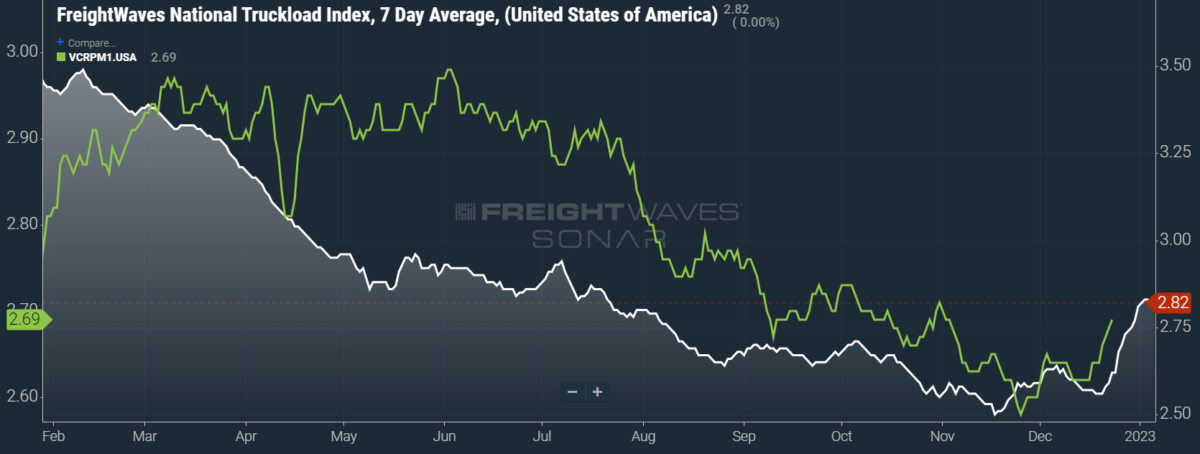
SONAR: National Truckload Index, 7-day average (white; right axis) and dry van contract rate (green; left axis).
To learn more about FreightWaves SONAR, click here.
This week, the National Truckload Index (NTI), which includes fuel surcharges and other accessorials, rose 7 cents per mile w/w to $2.82. Surprisingly, rising diesel prices have yet to be a factor on these gains, as the linehaul variant of the NTI (NTIL) — which excludes fuel surcharges and other accessorials — also rose 7 cents per mile w/w to $2.09. This current period marks the first time that the NTIL has touched $2 per mile since last July. Given the weakness already seen in OTVI and OTRI, however, it is very likely that linehaul spot rates will tumble in the coming weeks.
For new readers of this column, I have long anticipated that contract rates will suffer a dramatic decline in Q1 2023. Ever since the pandemic, shippers have endured their transportation budgets ballooning out of control. Now, as capacity has become far easier to secure in a freight-deprived environment, shippers can finally leverage their pricing power and drive down contract rates. Such a decline would have occurred earlier if not for the average length of bid cycles limiting rate adjustments. In Q1, I predict that many shippers’ bid cycles — whether on a yearly, quarterly or monthly basis — will align and that shippers will attempt to tame their transportation spend.
Yet since contract rates, which exclude fuel surcharges and other accessorials like the NTIL, are reported on a two-week delay, we have yet to see such movement. We will likely have to wait until February before we see whether my prediction is correct or false. The most recent contract rate data captures the run-up to Christmas, so it is little surprise that contract rates rose 7 cents per mile w/w to $2.69.
To learn more about FreightWaves SONAR, click here.
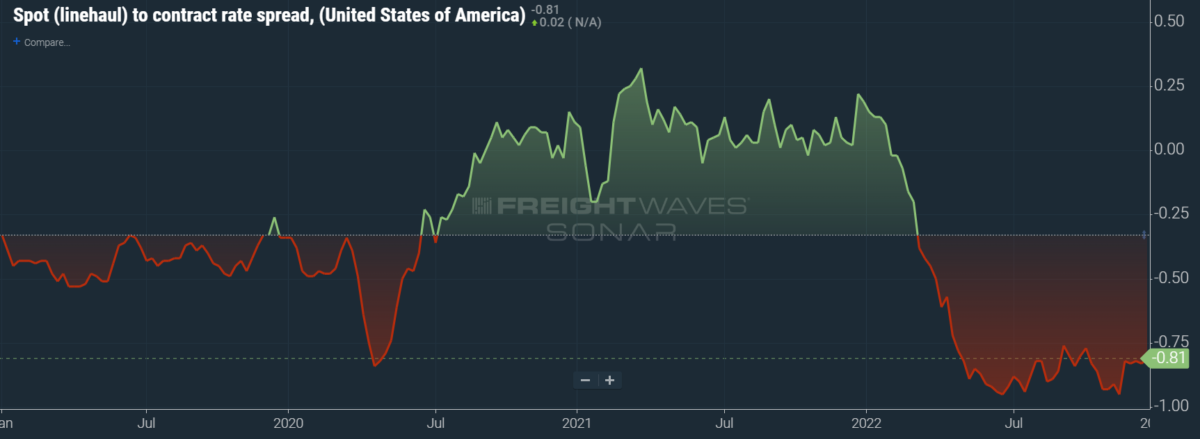
The chart above shows the spread between the NTIL and dry van contract rates, showing the index has continued to fall to all-time lows in the data set, which dates to early 2019. Throughout that year, contract rates exceeded spot rates, leading to a record number of bankruptcies in the space. Once COVID-19 spread, spot rates reacted quickly, rising to record highs on a seemingly weekly basis, while contract rates slowly crept higher throughout 2021.
As the linehaul spot rate remains 81 cents below contract rates, there is still runway for contract rates to decline throughout the next six months.
To learn more about FreightWaves TRAC, click here.
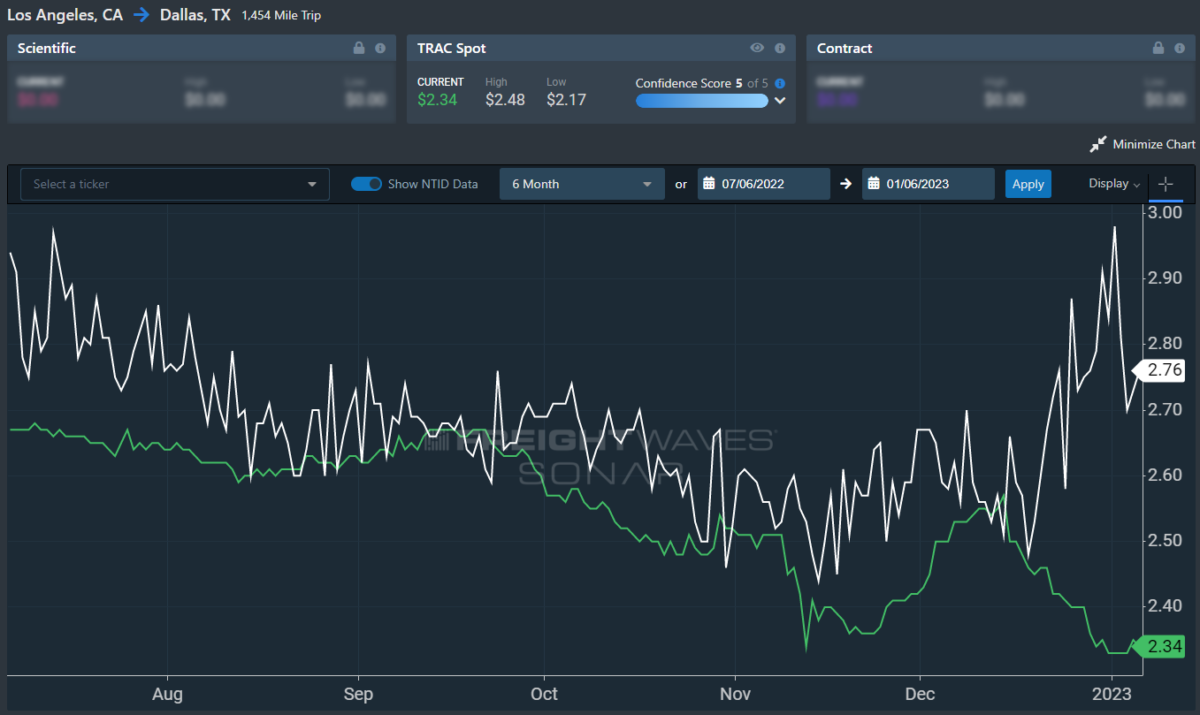
The FreightWaves TRAC spot rate from Los Angeles to Dallas, arguably one of the densest freight lanes in the country, actually declined over the holiday season. Over the past week, the TRAC rate remained unchanged at $2.34 per mile. The daily NTI (NTID), which is elevated at $2.76, continues to outpace rates from Los Angeles to Dallas.
To learn more about FreightWaves TRAC, click here.
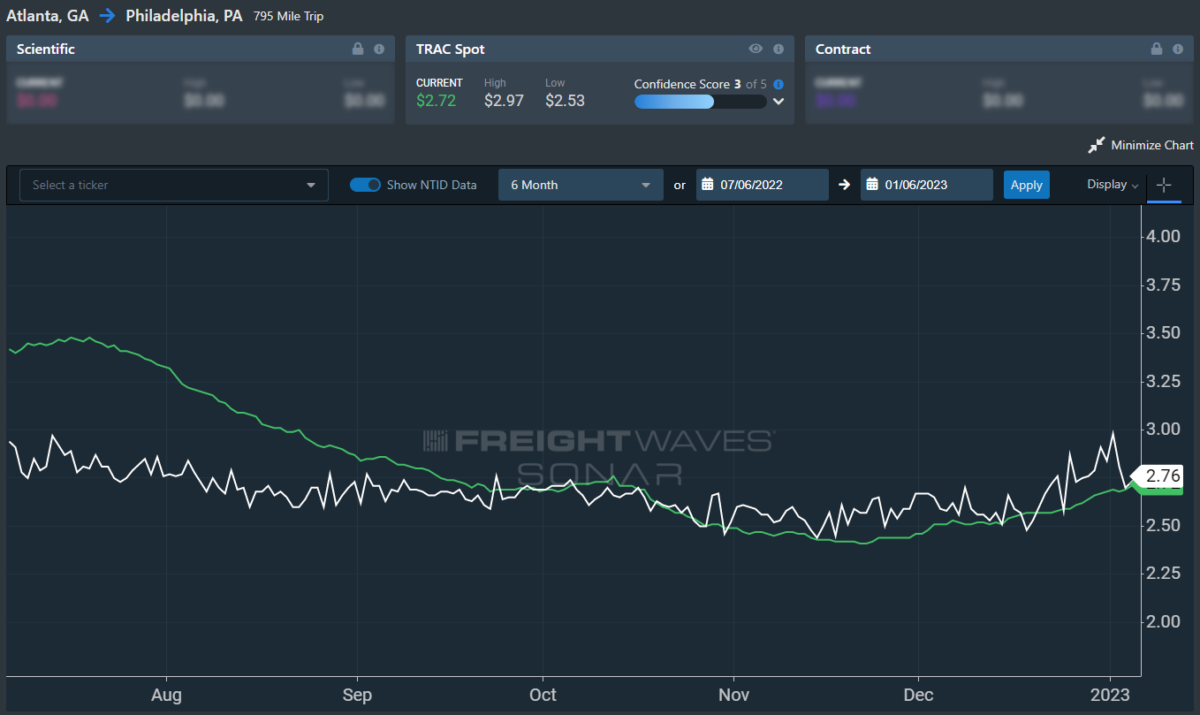
On the East Coast, especially out of Atlanta, rates increased in line with seasonality but are likewise underperforming against the NTID. The FreightWaves TRAC rate from Atlanta to Philadelphia rose 6 cents per mile this week to reach $2.72. Outside of the current holiday run, rates along this lane have been dropping stepwise since mid-July, when the TRAC rate was $3.48 per mile.
For more information on the FreightWaves Passport, please contact Michael Rudolph at [email protected] or Tony Mulvey at [email protected].


