This week’s FreightWaves Supply Chain Pricing Power Index: 30 (Shippers)
Last week’s FreightWaves Supply Chain Pricing Power Index: 30 (Shippers)
Three-month FreightWaves Supply Chain Pricing Power Index Outlook: 35 (Shippers)
The FreightWaves Supply Chain Pricing Power Index uses the analytics and data in FreightWaves SONAR to analyze the market and estimate the negotiating power for rates between shippers and carriers.
This week’s Pricing Power Index is based on the following indicators:
Economic turbulence jeopardizes a soft landing
Freight demand took a bit of a beating this week as several alarms were sounded across the broader economy. The labor market continues to convey mixed signals while manufacturers are firmly pessimistic about their near-term prospects. The consumer will be key to resolving the present tension in freight demand’s future, but consumers continue to be predictably unpredictable.
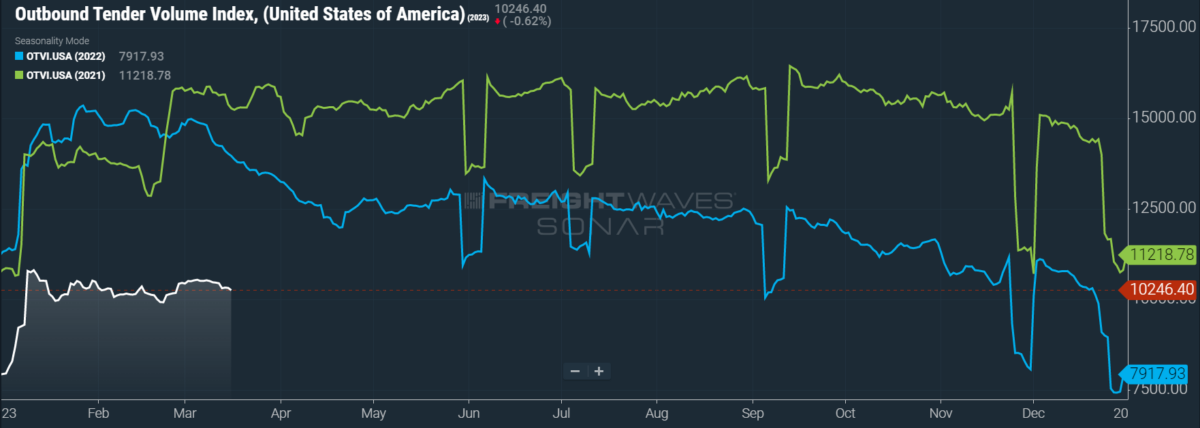
SONAR: OTVI.USA: 2023 (white), 2022 (blue) and 2021 (green)
To learn more about FreightWaves SONAR, click here.
This week, the Outbound Tender Volume Index (OTVI), which measures national freight demand by shippers’ requests for capacity, barely moved. OTVI dipped 2.42% on a week-over-week (w/w) basis. On a year-over-year (y/y) basis, OTVI is down 26.1%, though such y/y comparisons can be colored by significant shifts in tender rejections. OTVI, which includes both accepted and rejected tenders, can be artificially inflated by an uptick in the Outbound Tender Reject Index (OTRI).
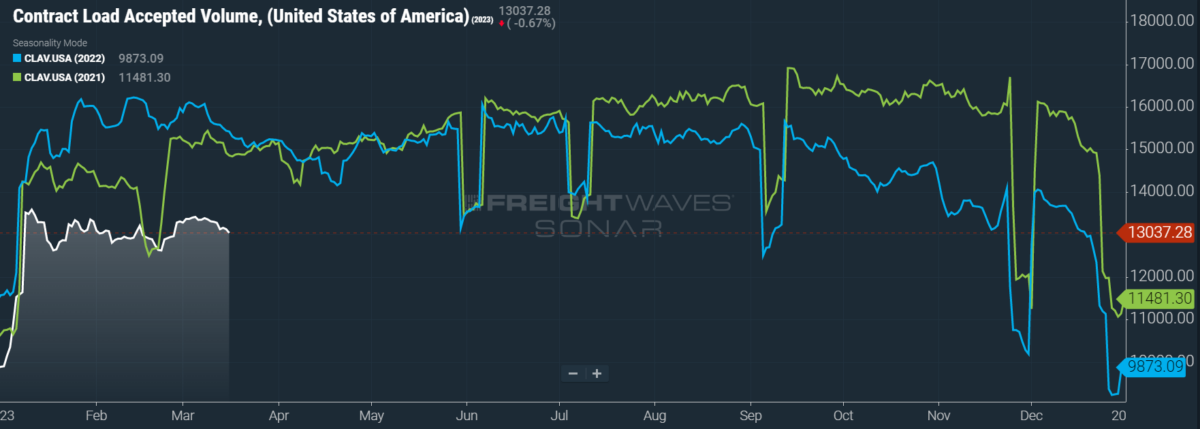
SONAR: CLAV.USA: 2023 (white), 2022 (blue) and 2021 (green)
To learn more about FreightWaves SONAR, click here.
Contract Load Accepted Volumes (CLAV) is an index that measures accepted load volumes moving under contracted agreements. In short, it is similar to OTVI but without the rejected tenders. Looking at accepted tender volumes, we see a dip of 2.4% w/w as well as a fall of 14.8% y/y. This y/y difference confirms that actual cracks in freight demand — and not merely OTRI’s y/y decline — are driving OTVI lower.
All eyes are on next week’s meeting of the Federal Open Market Committee (FOMC), which is tasked with the unenviable duty of navigating through confusing market data. The second- and third-largest bank failures in U.S. history just occurred swiftly over the past week, leading some investors to expect a brief pause in the FOMC’s current tightening cycle. Commodity markets took a huge blow as domestic oil prices have fallen nearly 15% since last Friday. Excluding the volatility of automotive sales, retail sales were down 0.1% on a monthly basis in February.
A greater degree of pessimism was found among manufacturing firms. Per a series of monthly surveys conducted by regional branches of the Federal Reserve, the industrial sector is bracing for a steep decline in general business conditions over the coming six months. Price increases for inputs are similarly expected to ease, which suggests that supply-side inflationary pressures are winding down. On the demand side, both headline and core inflation have cooled to their lowest yearly gains since late 2021.
But inflation, other analysts argue, still remains intractably elevated and the FOMC should not blink at the first sign of distress from the financial sector. Both initial and continuing jobless claims fell last week, key indicators of a robust labor market. Housing starts and building permits — especially for multifamily (i.e., rental) units — soared on a monthly basis in February by 9.8% and 13.8%, respectively. While there is a tangible risk of continued interest rate hikes triggering a recession, so also is there a risk of allowing inflation to run rampant. I am certainly no financial expert, but for what it’s worth, I expect the FOMC to split the difference with a modest 0.25% bump to federal interest rates.
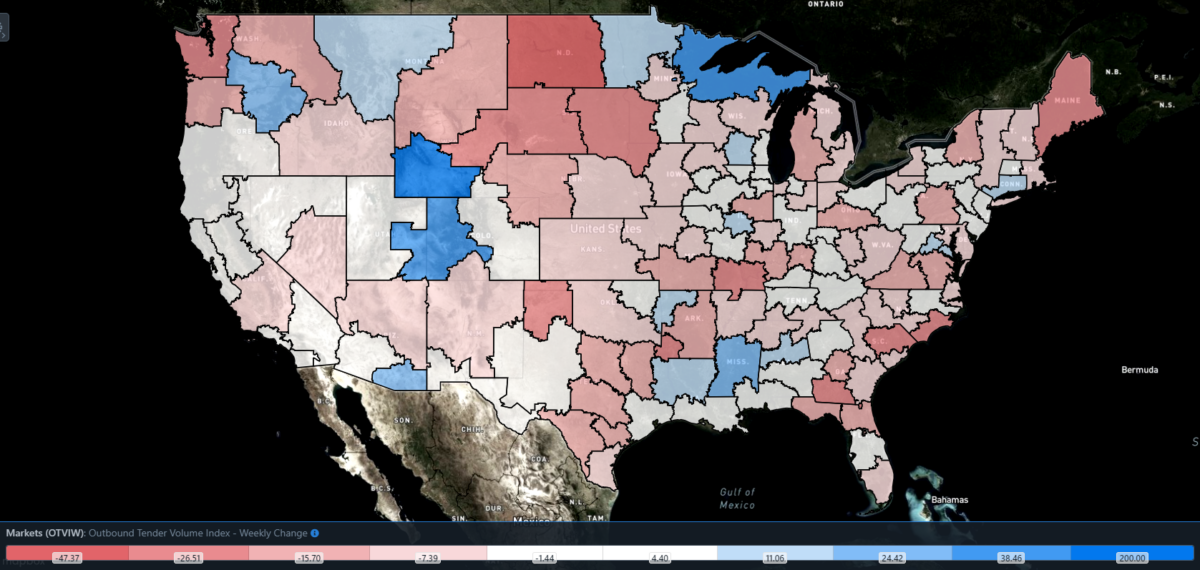
SONAR: Outbound Tender Volume Index – Weekly Change (OTVIW).
To learn more about FreightWaves SONAR, click here.
Of the 135 total markets, 49 reported weekly increases in tender volume with most major markets insulated from OTVI’s nationwide decline.
Houston was the belle of the ball this week, with roaring freight demand cementing the market as the second largest by outbound volume. Import volumes at Port Houston declined by a scant 1% y/y in January. Considering how successful the port was during 2022, to be in the ballpark of those volumes is significant. Port Houston is also gearing up for renovations to some of its container yards as part of an effort to modernize and increase cargo handling efficiency. At the time of writing, Houston’s tender volumes are only up 3.1% w/w, but saw a 22.4% w/w jump on Wednesday.
By mode: While reefer volumes did decline slightly this week, the Reefer Outbound Tender Volume Index (ROTVI) managed to outperform the overall OTVI. Washington markets continued to see gains from apples, potatoes and onions, with Oregon’s Pendleton market — which includes large swaths of Washington — seeing a 42.13% w/w rise in reefer demand. ROTVI on the whole, however, slid 0.24% w/w and is down 20.64% y/y.
Dry van activity was outpaced by the overall OTVI this week, with the Van Outbound Tender Volume Index (VOTVI) falling 2.5% w/w. Despite the aforementioned reasons for anxiety about the broader economy, the American consumer has proven to be fairly shortsighted and could conjure some demand in the upcoming tax rebate season. VOTVI is down 27.84% y/y in the meantime.
Carriers play the waiting game
Every so often, I find it important to take a step back and remind readers that these current movements in the national OTRI are fairly inconsequential. Outside of the winter holiday run, tender rejection rates have told the same story since late 2022 — namely, that carriers have very little pricing power in the spot market. There are two scenarios that will drive OTRI to significant change: first, if shippers’ (or consumers’) demand suddenly rises to meet capacity; second, if a large segment of carriers exit the marketplace, bringing supply and demand into balance.
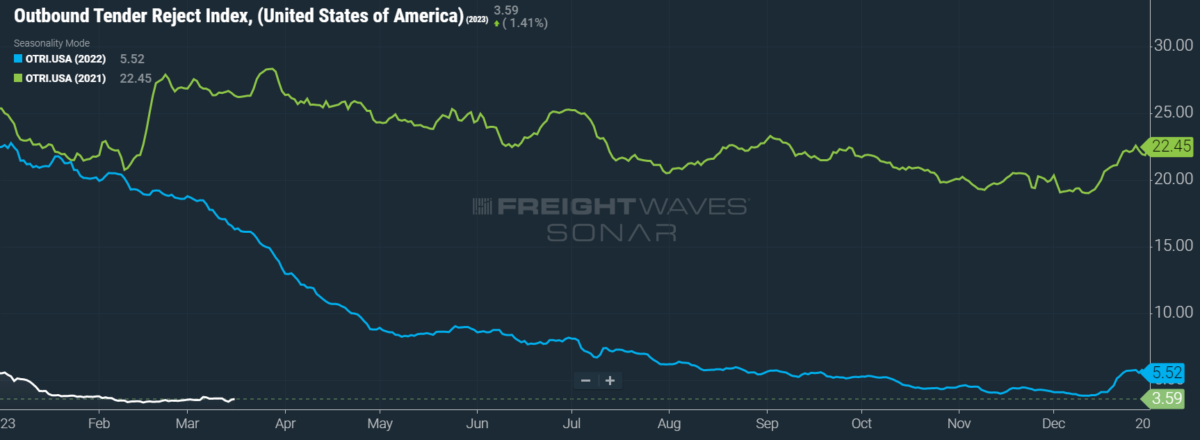
SONAR: OTRI.USA: 2023 (white), 2022 (blue) and 2021 (green)
To learn more about FreightWaves SONAR, click here.
Over the past week, OTRI, which measures relative capacity in the market, fell to 3.59%, a change of 3 basis points (bps) from the week prior. OTRI is now 1,277 bps below year-ago levels.
The Federal Motor Carrier Safety Administration proposed a 9% cut in carrier fees for registration and safety programs in 2024, slightly lessening a burden that amounts to a couple hundred dollars for the vast majority of carriers. This latest fee adjustment comes after a string of 14.5% y/y cuts in 2020 and ’21 and a 31% cut in ’22. The United Carrier Registration board, which recommends fee adjustments to the FMCSA, is bracing for an increase for the 2025 registration year since it does “not expect that there will be any additional excess funds from overcollection that can be applied to meet the total revenue target” in 2025.
A staggering majority of Americans support building overnight parking facilities for commercial trucks — but only if such facilities are at least 3 miles from their own homes. A recent survey conducted by CloudTrucks, a business management platform for owner-operators, found that Americans broadly appreciate the difficulties of being a truck driver but still adopt a “not-in-my-backyard” stance to improving infrastructure for carriers. Considering the ubiquity of trucking as a support to modern consumption, it is striking that roughly 21% of survey respondents did not realize that many drivers end up sleeping in their rigs.
SONAR: WRI (color)
To learn more about FreightWaves SONAR, click here.
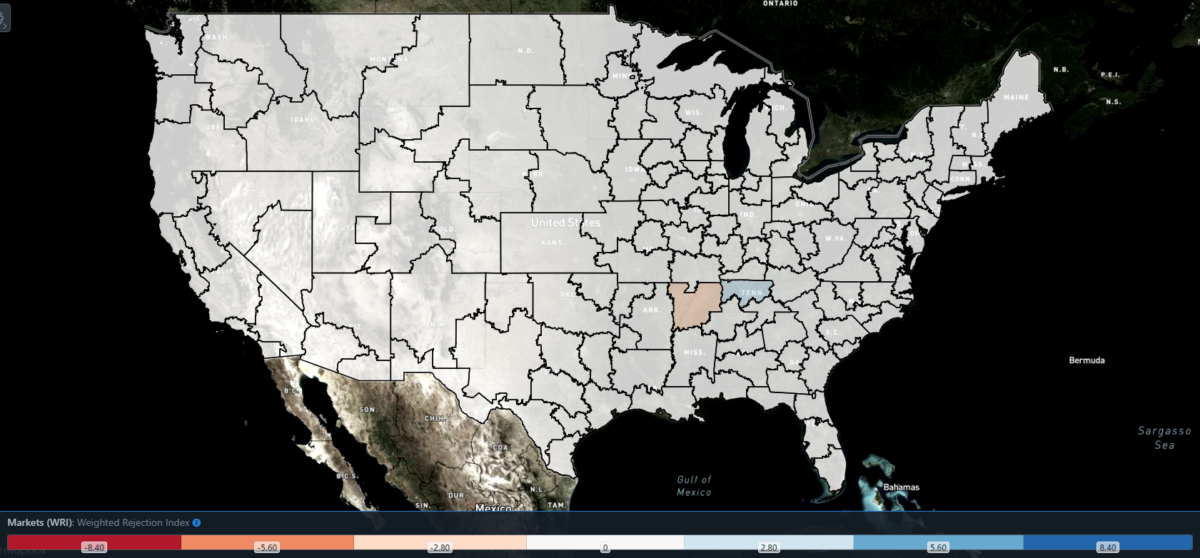
The map above shows the Weighted Rejection Index (WRI), the product of the Outbound Tender Reject Index — Weekly Change and Outbound Tender Market Share, as a way to prioritize rejection rate changes. As capacity is generally finding freight this week, only one region posted a blue market, which are usually the ones to focus on.
Of the 135 markets, 66 reported higher rejection rates over the past week, though 44 of those saw increases of only 100 or fewer bps.
Hard, late-winter freezes rocked Nashville, Tennessee, this week. These extreme temperatures led to several large burst water mains downtown, flooding the streets and slowing traffic in the region to a crawl. Nashville’s local OTRI swelled by 349 bps w/w to 6.91%, a fairly high reading for a midsized market. Nevertheless, Nashville is not exactly a hotbed for freight demand, given the region’s concentration on service and government jobs.
To learn more about FreightWaves SONAR, click here.
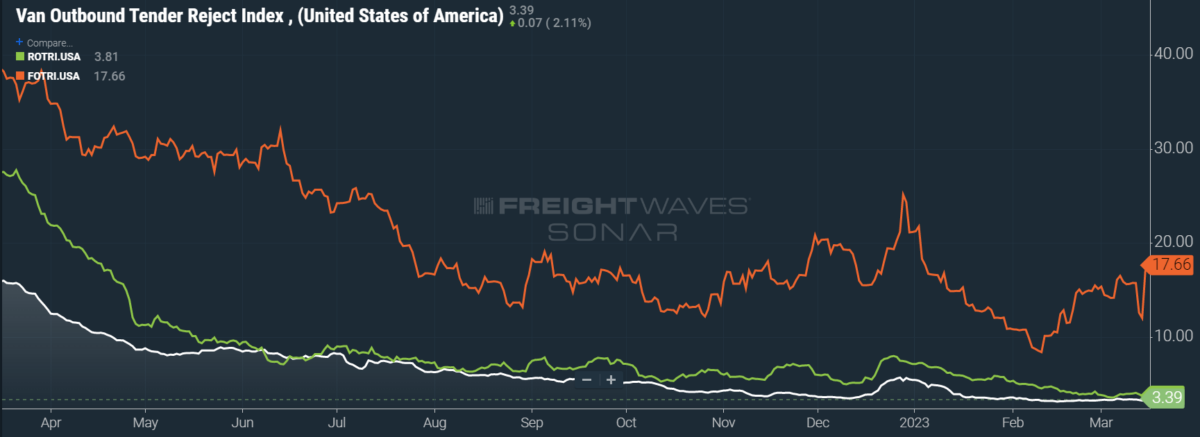
By mode: Flatbed tender rejection rates continued to see outrageous growth, with the Flatbed Outbound Tender Reject Index (FOTRI) further distancing itself from the single-digit lows of mid-February. No small part of this growth is likely due to the aforementioned jump in housing starts and building permits in February. FOTRI was up an impressive 202 bps w/w to 17.66%.
Other modes did not benefit from such growth. The Van Outbound Tender Reject Index (VOTRI) was down by a single basis point w/w to 3.39%, while the Reefer Outbound Tender Reject Index (ROTRI) fell 20 bps w/w to 3.81%. Given the gathering strength of reefer demand from produce season, ROTRI should see headwinds in the near-term future. Depending on how consumer activity shakes out, VOTRI could also see a bump from tax rebates.
Spot the difference
Unlike the relatively insignificant movements in OTRI, the decay of spot rates has a tangible impact on carriers. Given a modest estimate of 2,500 miles driven per week, the monthly decline in average spot rates is costing drivers hundreds of dollars in weekly revenue. If carriers are large (or lucky) enough to profit from the spread between retail and wholesale diesel prices, which currently sits at nearly $1.60 per gallon, some of this decline can be offset.
SONAR: National Truckload Index, 7-day average (white; right axis) and dry van contract rate (green; left axis).
To learn more about FreightWaves SONAR, click here.
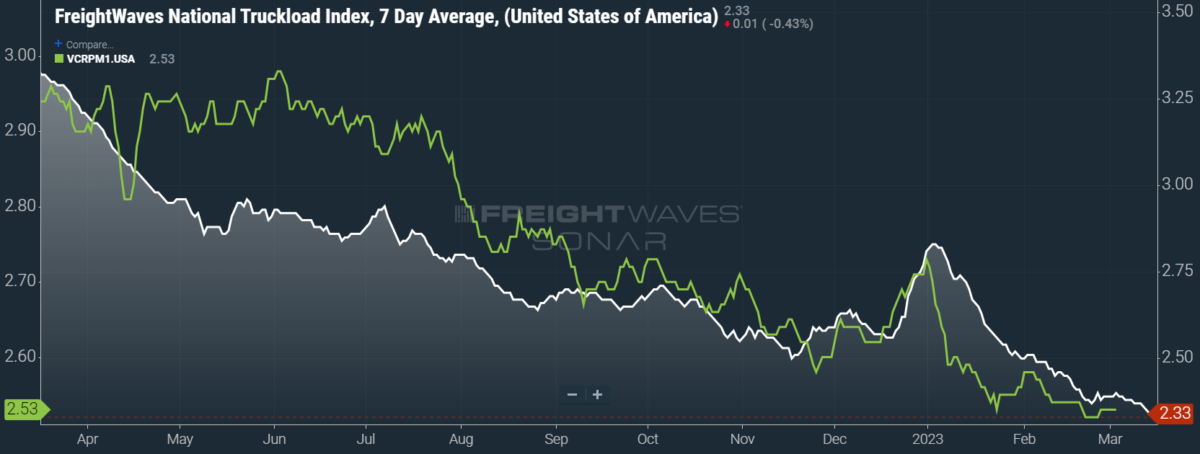
This week, the National Truckload Index (NTI) — which includes fuel surcharges and other accessorials — fell 4 cents per mile to $2.33. Unfortunately, the majority of this loss cannot be pinned on falling diesel prices, as the linehaul variant of the NTI (NTIL) — which excludes fuel surcharges and other accessorials — similarly fell 3 cents per mile w/w to $1.66.
Contract rates, which exclude fuel surcharges and other accessorials like the NTIL, saw a slight gain of 1 cent per mile w/w. Since the average length of shippers’ bid cycles is either on a quarterly or yearly basis, contract rates have remained quite stable since late January. Contract rates, which are reported on a two-week delay, presently sit at a national average of $2.53 per mile. Turning to the second quarter, I expect that contract rates will fall as shippers grow more confident in their pricing power. But shippers have proven themselves to be remarkably cautious and, given the potential for freight demand in Q2, I do not expect that they will drive contract rates to the bottom of the barrel.
To learn more about FreightWaves SONAR, click here.
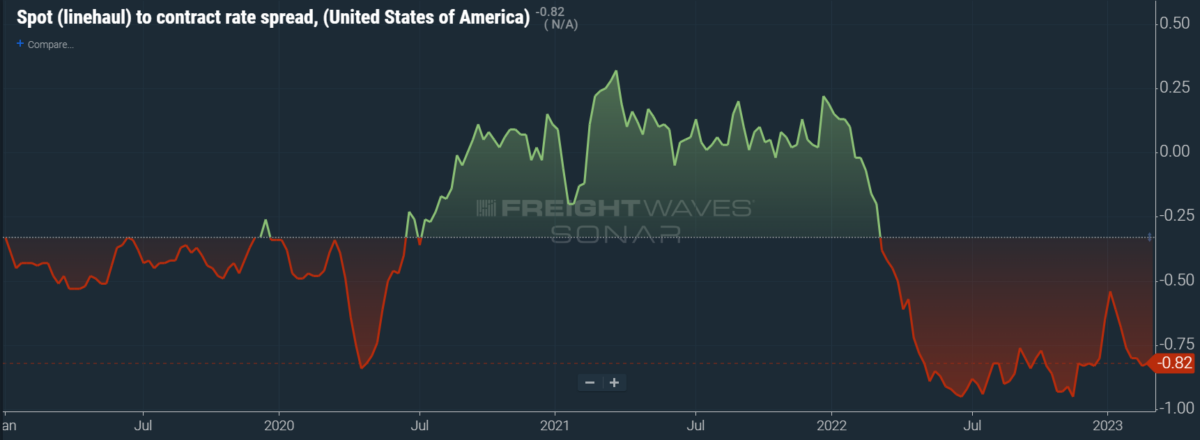
The chart above shows the spread between the NTIL and dry van contract rates, revealing the index has fallen to all-time lows in the data set, which dates to early 2019. Throughout that year, contract rates exceeded spot rates, leading to a record number of bankruptcies in the space. Once COVID-19 spread, spot rates reacted quickly, rising to record highs on a seemingly weekly basis, while contract rates slowly crept higher throughout 2021.
Despite this spread narrowing significantly over the first few weeks of the year, tightening by 20 cents per mile in January, it has continued to widen again. Since linehaul spot rates remain 82 cents below contract rates, there is still plenty of room for contract rates to decline over the coming months.
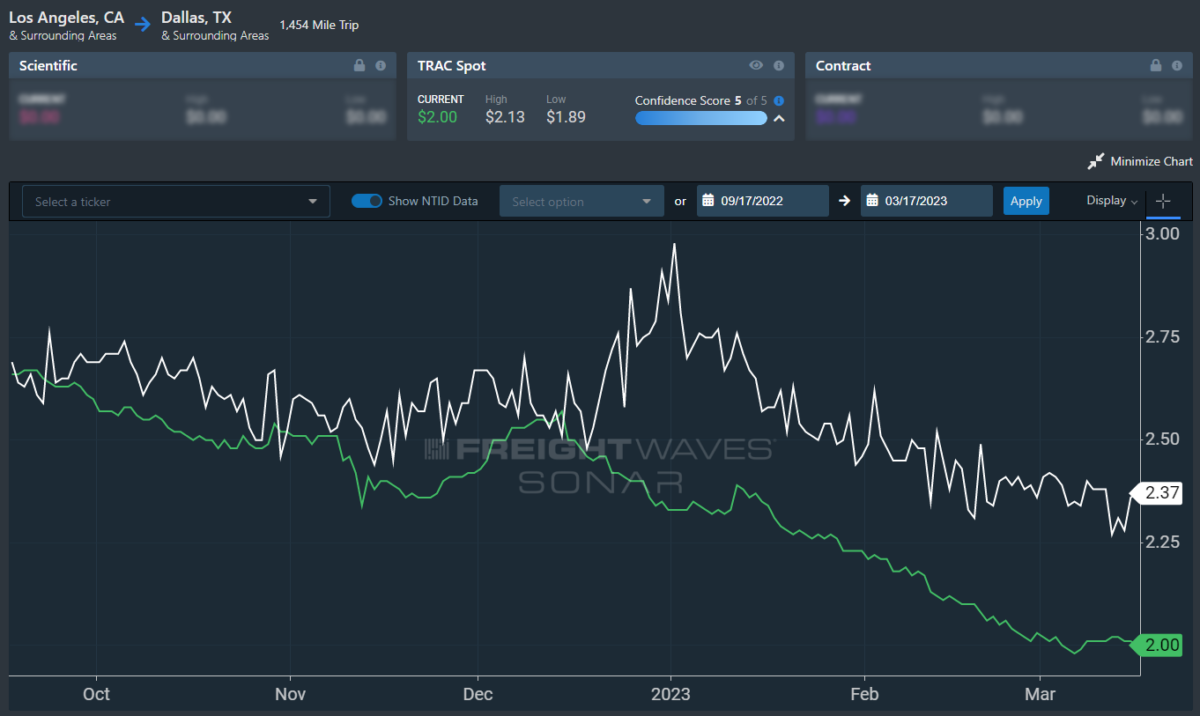
To learn more about FreightWaves TRAC, click here.
The FreightWaves TRAC spot rate from Los Angeles to Dallas, arguably one of the densest freight lanes in the country, was on an unstoppable decline since January but has finally leveled out. Over the past week, the TRAC rate fell 1 cent per mile to $2, still a far cry from its year-to-date high of $2.39. The daily NTI (NTID), which sits at $2.37, is greatly outpacing rates from Los Angeles to Dallas.
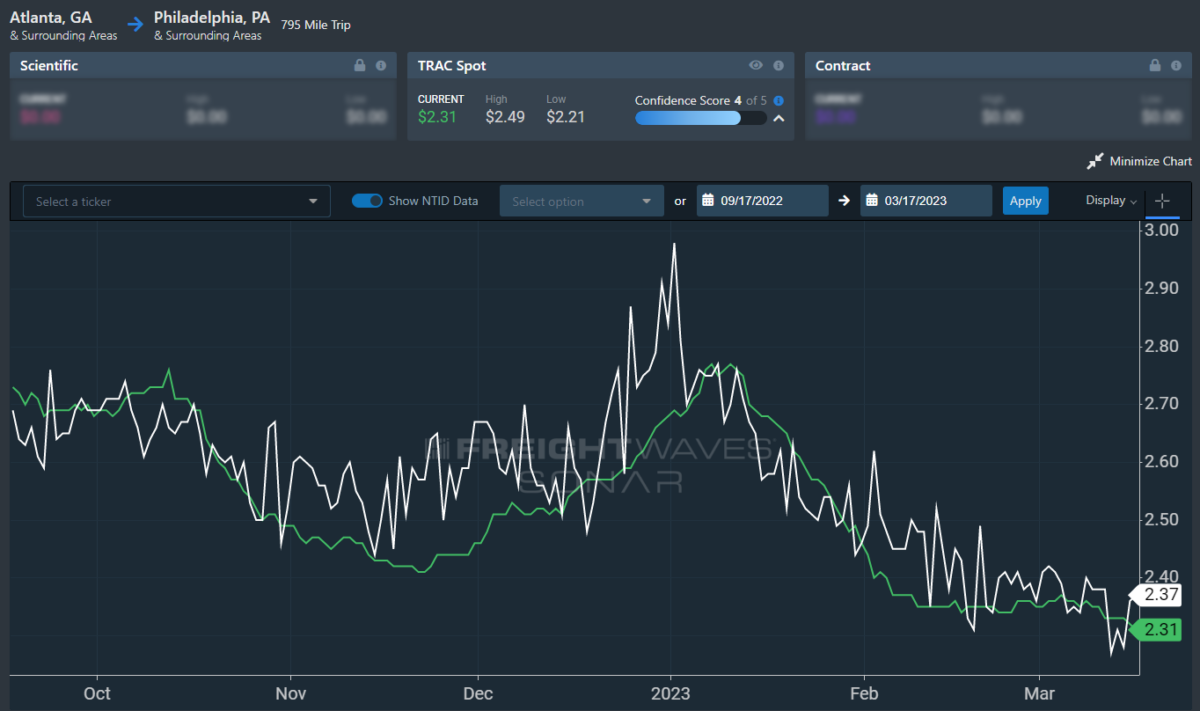
To learn more about FreightWaves TRAC, click here.
On the East Coast, especially out of Atlanta, rates declined and are similarly outpaced by the NTID. The FreightWaves TRAC rate from Atlanta to Philadelphia fell 4 cents per mile this week to reach $2.31. Except for Q4’s holiday run, rates along this lane have been dropping stepwise since July 2022, when the TRAC rate was $3.48 per mile.
For more information on the FreightWaves Passport, please contact Michael Rudolph at [email protected] or Tony Mulvey at [email protected].


