


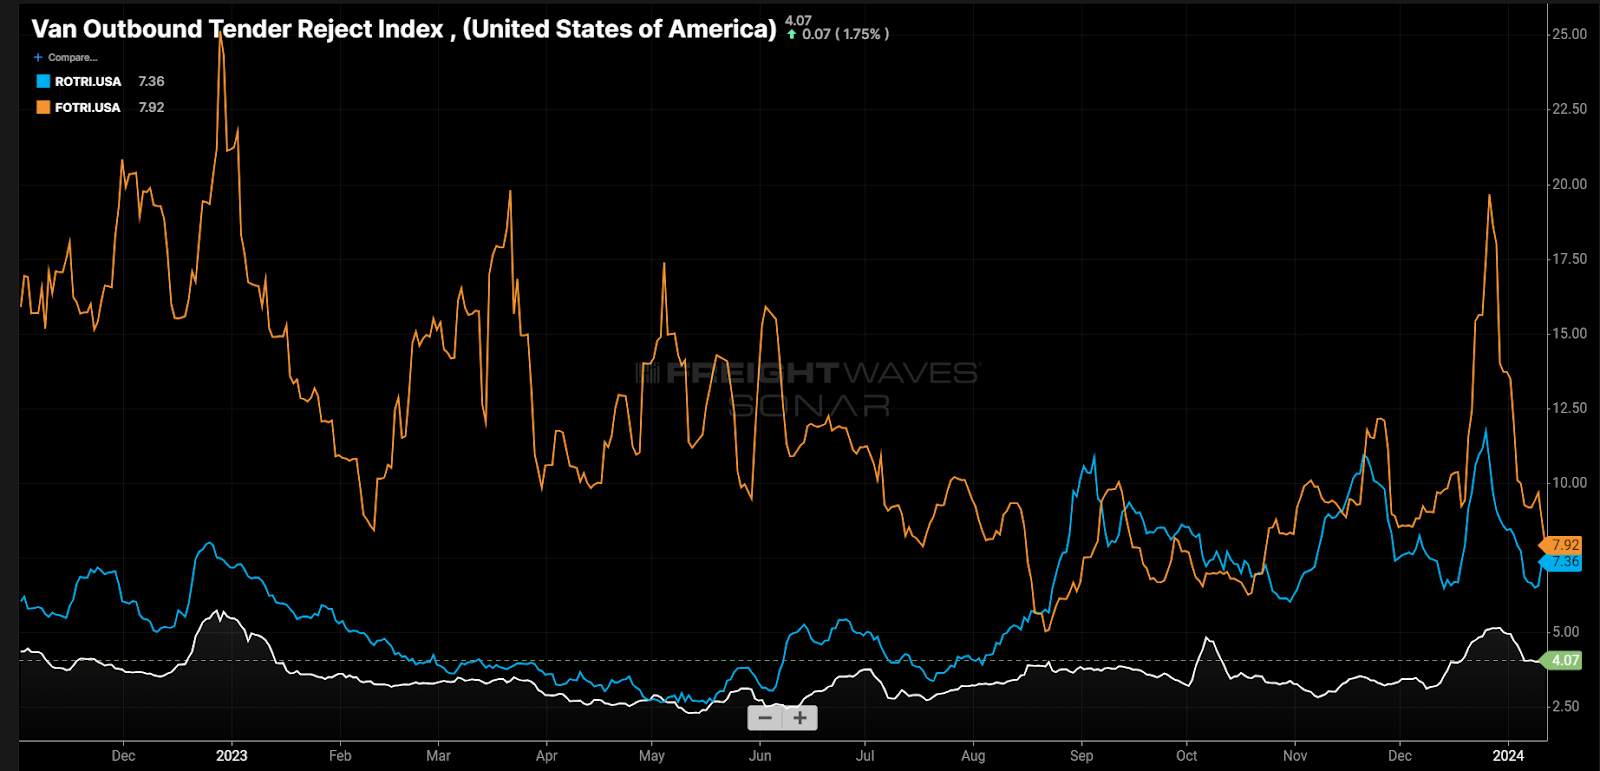
Chart of the Week: Outbound Tender Rejection Index – Van, Reefer, Flatbed SONAR: VOTRI.USA, ROTRI.USA, FOTRI.USA
Tender rejection rates for the three main trailer types all spiked as they seasonally do around Christmas. The aggregate read is that the market remains oversupplied with capacity, but that statement does not apply evenly.
Let’s take a look at the less-served equipment types of flatbed and refrigerated (reefer) and read the data to see what 2024 may hold for each.
Flatbed flattening
The flatbed space has been less stable than its dry van and refrigerated counterparts since the freight market collapsed in March 2022. Flatbed is more closely tied to manufacturing, energy and construction. Each of those sectors was handicapped during the pandemic thanks in large part to supply chain issues and quarantining. As a result, less attention was given to the space and therefore less capacity was added.
This is evidenced by an average tender rejection rate above 10% in 2023 compared to about 6% for reefer and about 3.3% for van. Some of the elevation is due to a much lower volume of representation inside the tender data, but flatbed rejection rates averaged lower than the other two trailer types in 2020-H1 of 2021 — a highly unusual development.
The general direction for national flatbed rejection rates was lower in 2023, averaging 9% in the second half of the year versus 13% in the first six months.
Flatbed activity tends to slow in the winter months due to the nature of the freight and weather conditions, but that is not an absolute and it does not mean the space loosens necessarily as capacity naturally declines because of this expectation.
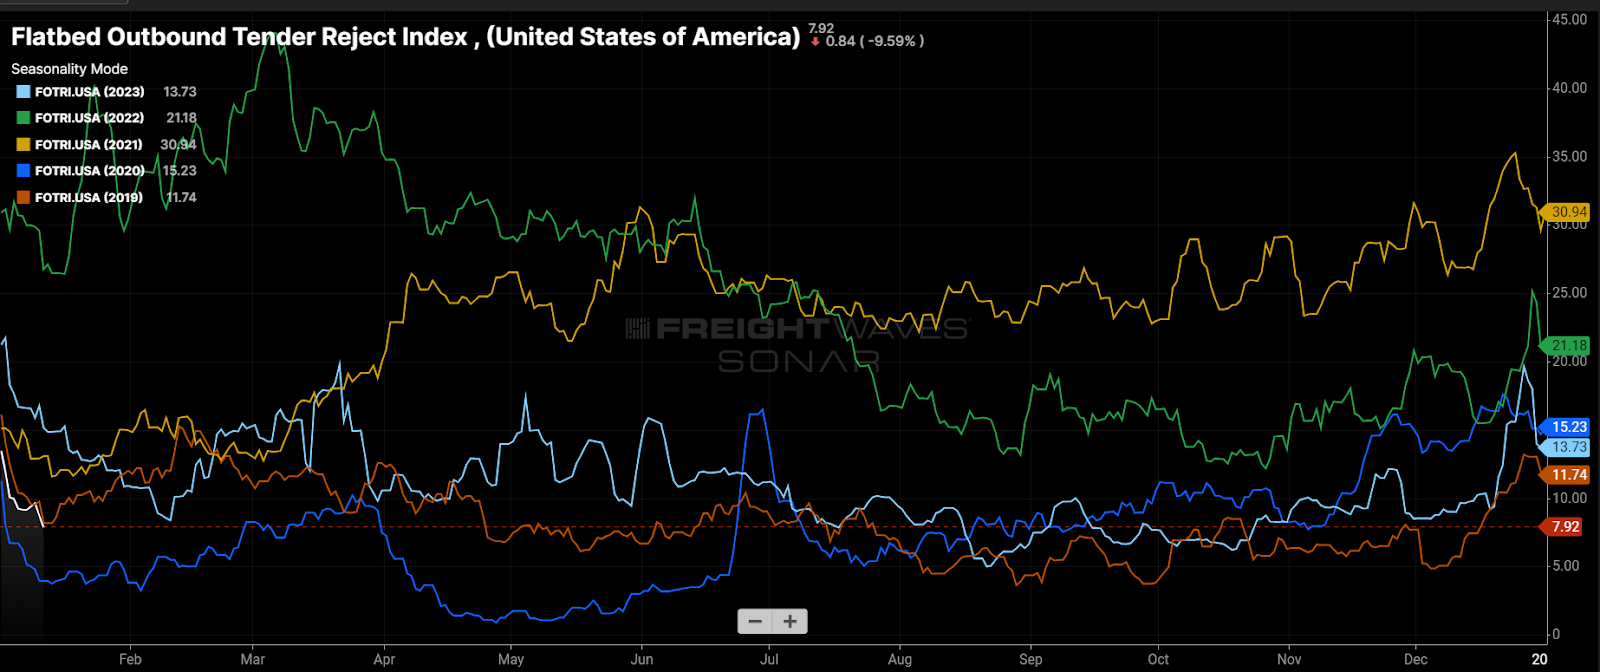
Flatbed rejection rates topped out just under 20% this year — its third-highest holiday value of the past five years, but below 2022. The read is that the flatbed market is stabilizing but still exposed to wild swings and nowhere nearly as stable as its closed-deck siblings.
Reefer madness
The refrigerated/reefer sector was the hottest trailer type in 2020-21 but became as easy to attain as the more common dry van counterpart in 2022 and through the first half of 2023.
Since May, however, the reefer space has started to perk up a bit, with rejection rates pulling off their floor values and sustaining at a level above van. After hitting a floor value of 2.7% and falling into perfect alignment with the Van Outbound Tender Reject Index (VOTRI) in May, the Reefer Outbound Tender Reject Index (ROTRI) topped 10% three times in the back half of the year.
Each of these peaks occurred around the three main holidays of the second half, but the main takeaway is that they were all higher than their 2022 values around the same time.
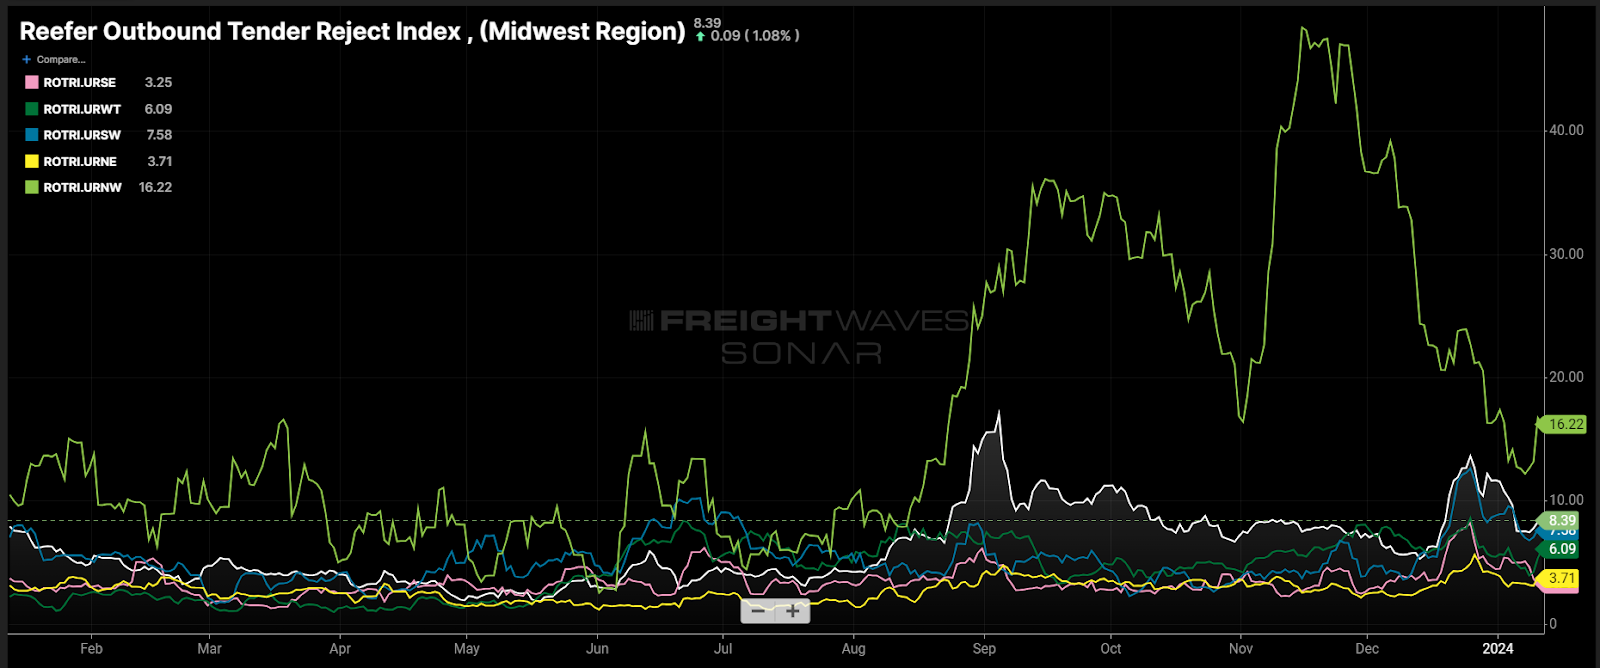
Looking at the ROTRI broken down by region, the main drivers of the increasing rejection rates occurred in the North and Midwestern regions. The Pacific Northwest has two major seasonal periods driven by harvests and Christmas trees.
Normally this area of the country is extremely well supplied, with carriers avoiding too much inbound freight as they have extreme challenges getting back out of the area. The terrain is also treacherous and weather can be a large disruption.
Erratic demand has always been a challenge, but the fact that it seems more of a factor tells us that the market has had a more impactful reduction in capacity this year than the van side. The late-year rejection rate trend, which may be more exacerbated by region, is for tightening to continue with the floor in the rearview.
About the Chart of the Week
The FreightWaves Chart of the Week is a chart selection from SONAR that provides an interesting data point to describe the state of the freight markets. A chart is chosen from thousands of potential charts on SONAR to help participants visualize the freight market in real time. Each week a Market Expert will post a chart, along with commentary, live on the front page. After that, the Chart of the Week will be archived on FreightWaves.com for future reference.
SONAR aggregates data from hundreds of sources, presenting the data in charts and maps and providing commentary on what freight market experts want to know about the industry in real time.
The FreightWaves data science and product teams are releasing new datasets each week and enhancing the client experience.
To request a SONAR demo, click here.
Erik Male (M) Ness
Anyway to overlap the weather conditions when discussing tender rejections?
Hilarion Zarraga
Hi. Any data or statistics on car hauling??
Rick Davies
This information didn’t tell anything for the 2024 year or even the first quarter of the year so howvis anyone going to know what is in store for owner operators. I myself would like to know about this year.
Steven Manson
Article states there is an oversupply. But when I go to Walmart the stuff I usually want has been stripped off the shelves. It’s been THREE years there’s other reasons for slow freight