


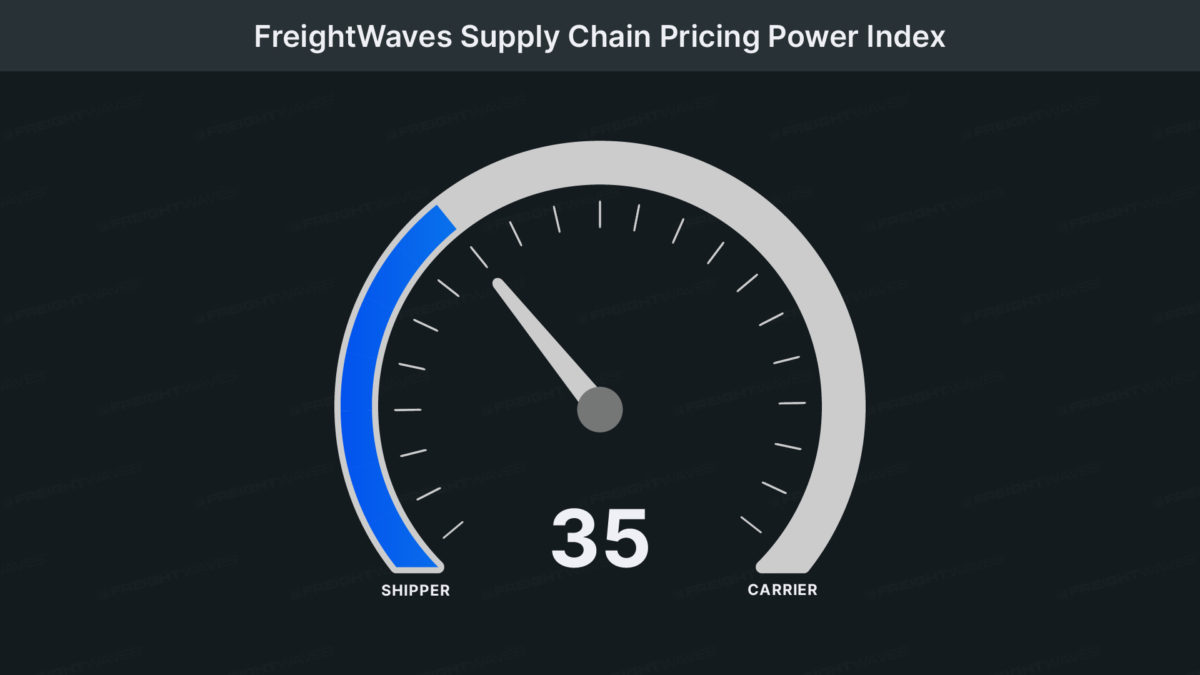
This week’s FreightWaves Supply Chain Pricing Power Index: 35 (Shippers)
Last week’s FreightWaves Supply Chain Pricing Power Index: 35 (Shippers)
Three-month FreightWaves Supply Chain Pricing Power Index Outlook: 35 (Shippers)
The FreightWaves Supply Chain Pricing Power Index uses the analytics and data in FreightWaves SONAR to analyze the market and estimate the negotiating power for rates between shippers and carriers.
This week’s Pricing Power Index is based on the following indicators:
A sleep and a forgetting
Freight demand has returned with a vengeance, as the flow of accepted volumes is outpaced even the booming years of 2021 and 2022 (the latter of which saw an unseasonably active Q1 before heralding the current downturn and recovery). Great news but, before any champagne gets popped, numerous caveats must be made.
First, as will be discussed in more detail below, tender rejections are languishing at substandard levels. When I write that shippers have been energetic in the first two weeks of 2024, carriers and brokers will likely scratch their heads — and rightfully so. The sustained imbalance between supply and demand has yet to be corrected, such that only an unprecedented tidal wave of demand could satisfy the current amount of capacity in the national freight economy. To hope for anything beyond precedent after these wild past few years is reckless, to say the least.
Second, we have only now shaken off the holiday lull that curbed truckload activity, so it would be hasty to draw any far-reaching conclusions just yet. Finally, although there are many positive signs for domestic freight demand in the not-too-distant future, there are also numerous headwinds varying in strength for 2024.
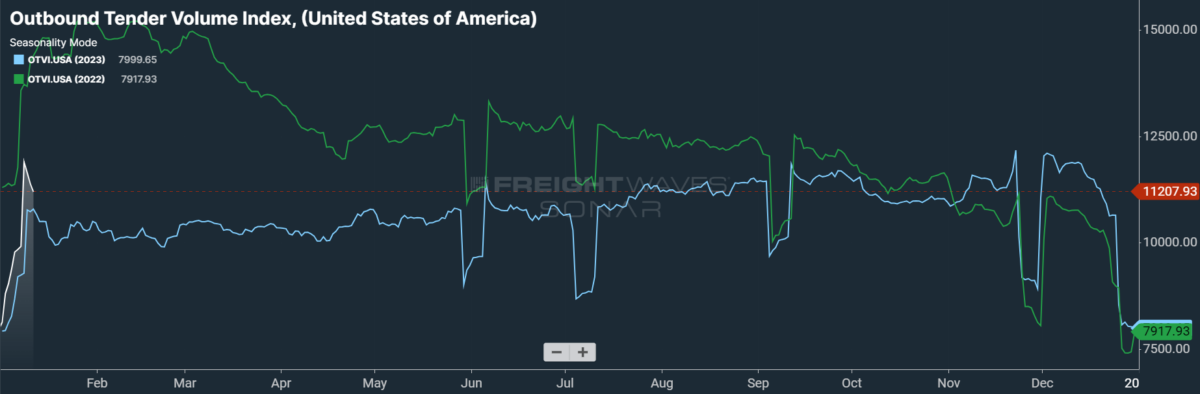
SONAR: OTVI.USA: 2024 (white), 2023 (blue) and 2022 (green)
To learn more about FreightWaves SONAR, click here.
This week, the Outbound Tender Volume Index (OTVI), which measures national freight demand by shippers’ requests for capacity, rose 5% year over year (y/y). Weekly comps are not extremely informative at present, given the battery of winter holidays over the past few weeks. That said, y/y comparisons can be colored by significant shifts in tender rejections. OTVI, which includes both accepted and rejected tenders, can be inflated by an uptick in the Outbound Tender Reject Index (OTRI).
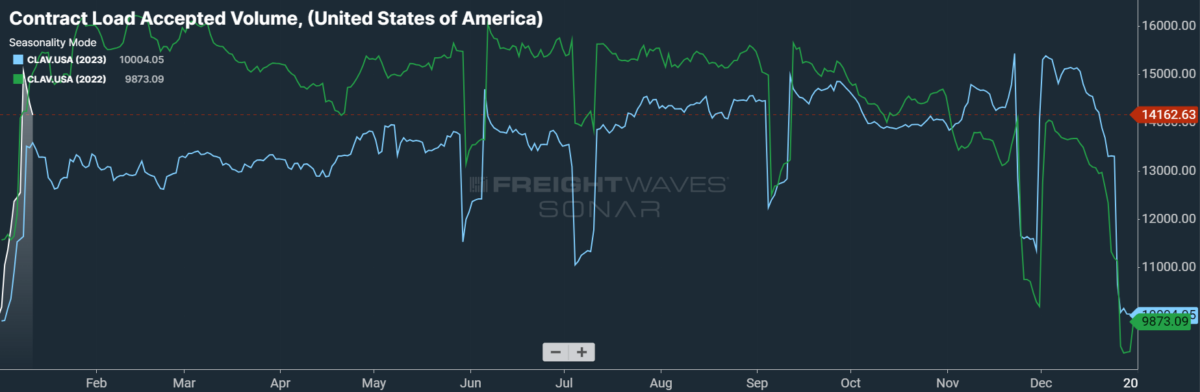
SONAR: CLAV.USA: 2024 (white), 2023 (blue) and 2022 (green)
To learn more about FreightWaves SONAR, click here.
Contract Load Accepted Volume is an index that measures accepted load volumes moving under contracted agreements. In short, it is similar to OTVI but without the rejected tenders. Looking at accepted tender volumes, we see a rise of 6.88% y/y. This positive y/y difference implies that actual freight flow is recovering from this cycle’s bottom.
With August 2022’s signing of the Inflation Reduction Act as well as the CHIPS and Science Act, manufacturing firms have been offered over $250 billion worth of tax credits and other incentives to catalyze reshoring operations. Yet while there is a bevy of such projects fueled by government spending near at hand, the industrial sector has been slow to recover from its current depression. According to data from the Institute for Supply Management, December marked 14 consecutive months of contraction in the manufacturing sector.
In a similarly conflicting vein, the December jobs report revealed a labor market that was far hotter than consensus expectations, casting doubt on the possibility of near-term interest rate cuts from the Federal Reserve. In December, the U.S. added a staggering 216,000 jobs, far above both the consensus growth forecast of 175,000 and even the high-end estimates of 190,000. Still, the month secured easy comps against October and November, both months for which initial payroll readings were revised substantially lower.
Confusion mounts, however, when turning to the report’s Household Survey, which tracks the number of newly employed persons rather than newly created positions. According to December’s Household Survey, the number of employed workers tumbled by 683,000 — the largest monthly drop since April 2020, when the global economy grappled with unprecedented lockdowns. That December was a weak month for job growth is not surprising in itself, since the month consistently ranks as the second-most popular month for job cuts. But the question that remains unanswered is how the Fed will interpret this report at its next meeting in late January, and whether it will walk back some of its previously dovish messaging.
Inflation data from last month will likely persuade the Fed to consider pivoting back to a default hawkishness. The headline consumer price index (CPI) came in slightly hotter than expected, rising 0.3% month over month (m/m) and 3.4% y/y against consensus forecasts of 0.2% m/m and 3.2% y/y gains. On the other hand, the core CPI — which excludes goods with volatile pricing like food and energy — posted a gain of less than 4% y/y for the first time since May 2021. And while energy prices (down 2% y/y) continued to tumble from previous highs, food prices (up 2.7% y/y) rose steadily, a trend particularly acute in prices for food away from home (up 5.2% y/y).
When looking to make heads or tails of this data, perhaps the single deciding factor is “supercore” inflation, or core services less housing. In its protracted fight against inflation, the Federal Reserve has consistently named supercore inflation as its most valued metric. Last month, supercore inflation spiraled 0.4% m/m and 4.1% y/y. At the start of December, the Fed broadcast unambiguously dovish signals, leading some analysts to believe that rate cuts could take effect as soon as March. The Fed has since retreated from this naked dovishness to its more familiar stance of intentional inscrutability. December’s supercore inflation data will likely persuade the Fed to hold its cards even closer to the chest in the coming weeks.
By mode: Reefer demand is relatively stagnant at the start of January, trending only slightly above 2023 levels. Yet reefer volumes could soon ignite as winter storms threaten much of the Great Plains and upper Pacific Northwest, since reefers are commonly used to insulate freight against severe temperatures. One of the greatest periods for reefer demand in recent history was late February and early March 2021, when a severe cold wave swept across North America, causing power outages and damaging infrastructure. While we cannot hope for a repeat of such a catastrophic storm, it serves to illustrate the point that reefer demand benefits from cold weather. For the time being, however, the Reefer Outbound Tender Volume Index is up a slim 1.88% y/y.
Van volumes, on the other hand, face slightly easier comps but are positioned to fail even those in the coming weeks. The Van Outbound Tender Volume Index (VOTVI) shot up in the second week of January but has been falling precipitously over the past two days. At the time of writing, VOTVI is still up 3.01% y/y.
Purgatorial blues
There is not much left to say about tender rejections that has not been said already. OTRI kicked off 2024 below even the dismal levels of the previous year and has flatlined in the days since. While the transportation sector suffered a loss of 22,600 jobs in December, this figure was almost entirely caused by the 32,300 positions lost among couriers and messengers (a category that includes parcel delivery services). Amazingly, the truck transportation subsector gained 3,300 jobs in the month. It is a sad fact that bears repeating: The market will not rebalance until capacity is shed.
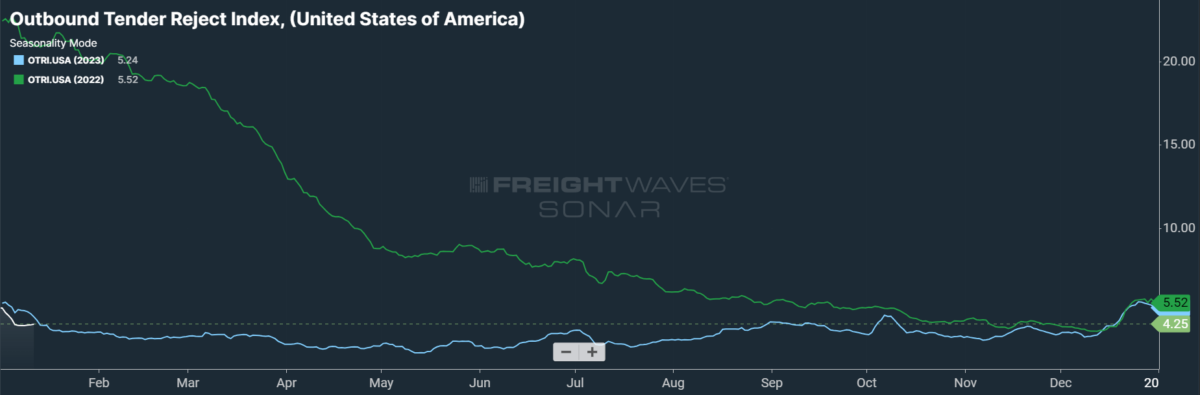
SONAR: OTRI.USA: 2024 (white), 2023 (blue) and 2022 (green)
To learn more about FreightWaves SONAR, click here.
Over the past week, OTRI, which measures relative capacity in the market, fell to 4.25%, a change of 30 basis points from the week prior. OTRI is now 44 bps below year-ago levels, despite facing incredibly easy comps.
The Department of Labor has finally released its formal update on a contentious rule that could reclassify certain independent owner-operators as company drivers: that is, as employees of the carriers that hire them. If reclassified as employees, such owner-operators would be entitled to benefits like health insurance, but could also face restrictions on their operational autonomy. Ultimately, the new update brings little clarity to the issue, alternately favoring employee status and independent contractor status throughout. Clarity will be found when the issue is brought before the courts, which will use the DOL regulation as one precedent among many.
To learn more about FreightWaves SONAR, click here.
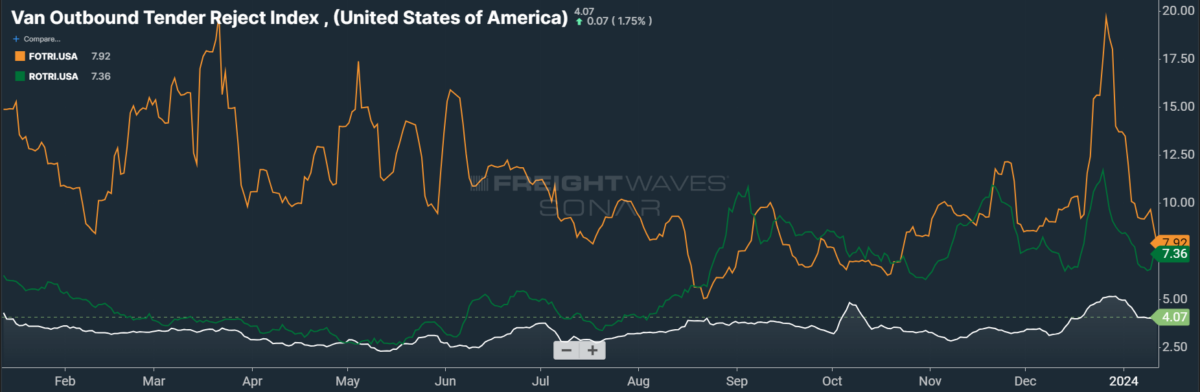
By mode: Flatbed rejection rates have fallen dramatically from their recent peak, at which point flatbed carriers were rejecting nearly one in five loads. The construction sector has broadcast encouraging signals for future demand, as housing starts rose a blistering 14.8% m/m in November. This surge was driven almost exclusively by rising single-family housing starts, which soared 18% m/m. Although the average rate on a 30-year fixed mortgage has come down from October’s high of 7.79%, it has begun to tick up throughout 2024 so far, currently sitting at an ominous 6.66%. The Flatbed Outbound Tender Reject Index, meanwhile, has fallen 202 bps to 7.92% since last week.
Despite relative stagnation in reefer demand, reefer rejection rates are beginning to rise once more, implying that the holiday bump is no longer in play. Instead, cold winter weather is likely to drive organic growth among reefer rejection rates over the next few weeks. At present, the Reefer Outbound Tender Reject Index is down 37 bps since last week at 7.36%, but is trending distinctly upward.
See spot stay
Spot rates are sustaining their holiday momentum with surprising tenacity. In the first 11 days of 2023, spot rates had fallen 9 cents per mile from their early peak for a loss of 3.2%. So far into 2024, spot rates have only declined 2% or 5 cents per mile from their year-to-date high. While the difference is not staggering, it is nevertheless a positive sign that the market is in recovery — however slow and agonizing it might be. Furthermore, diesel prices have continued to follow oil prices downward in 2024, more than 70 cents per gallon lower than they were at this time last year.
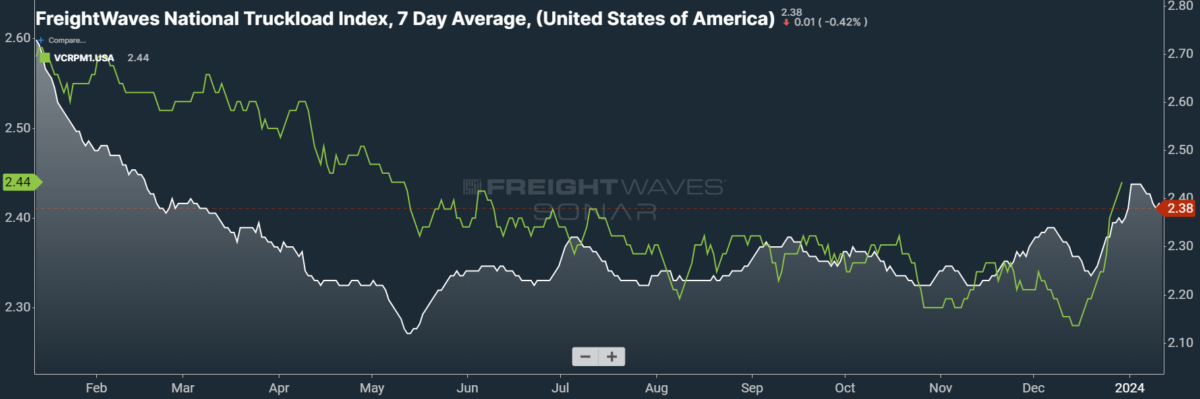
SONAR: National Truckload Index, 7-day average (white; right axis) and dry van contract rate (green; left axis).
To learn more about FreightWaves SONAR, click here.
This week, the National Truckload Index (NTI) — which includes fuel surcharges and other accessorials — fell 5 cents per mile to $2.38. Declining diesel prices were partially responsible for this week’s loss, as the linehaul variant of the NTI (NTIL) — which excludes fuel surcharges and other accessorials — fell 4 cents per mile to $1.77.
Contract rates, which are reported on a two-week delay, are showing massive gains made at the end of 2023, albeit ones that failed to match year-ago highs. The quickness with which contract rates lose their holiday momentum will be an early indication of the pricing power that shippers exercised in the ongoing bid cycle. For the time being, contract rates — which exclude fuel surcharges and other accessorials like the NTIL — are up 10 cents per mile on a weekly basis at $2.44.
To learn more about FreightWaves SONAR, click here.
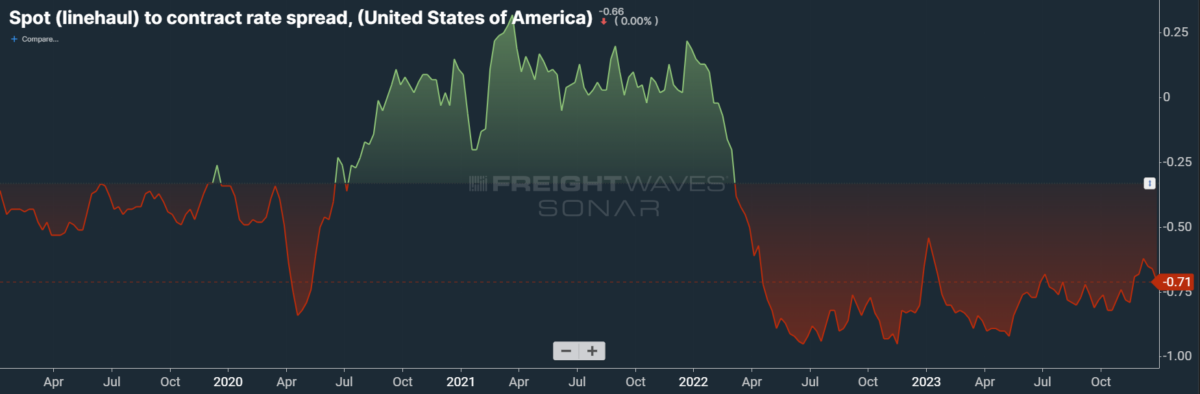
The chart above shows the spread between the NTIL and dry van contract rates, revealing the index has fallen to all-time lows in the data set, which dates to early 2019. Throughout that year, contract rates exceeded spot rates, leading to a record number of bankruptcies in the space. Once COVID-19 spread, spot rates reacted quickly, rising to record highs seemingly weekly, while contract rates slowly crept higher throughout 2021.
Over the course of 2023, this spread averaged 10 cents lower than in 2022, indicating that contract rates had yet to come into balance with the market’s fundamentals of carriers’ supply and shippers’ demand. These lopsided fundamentals were more appropriately reflected in spot rates, which are highly reactive to shifting market conditions. As linehaul spot rates remain 71 cents below contract rates, there is plenty of room for contract rates to decline — or for spot rates to rise — in the first half of 2024.
For more information on the FreightWaves Passport, please contact Michael Rudolph at [email protected] or Tony Mulvey at [email protected].