


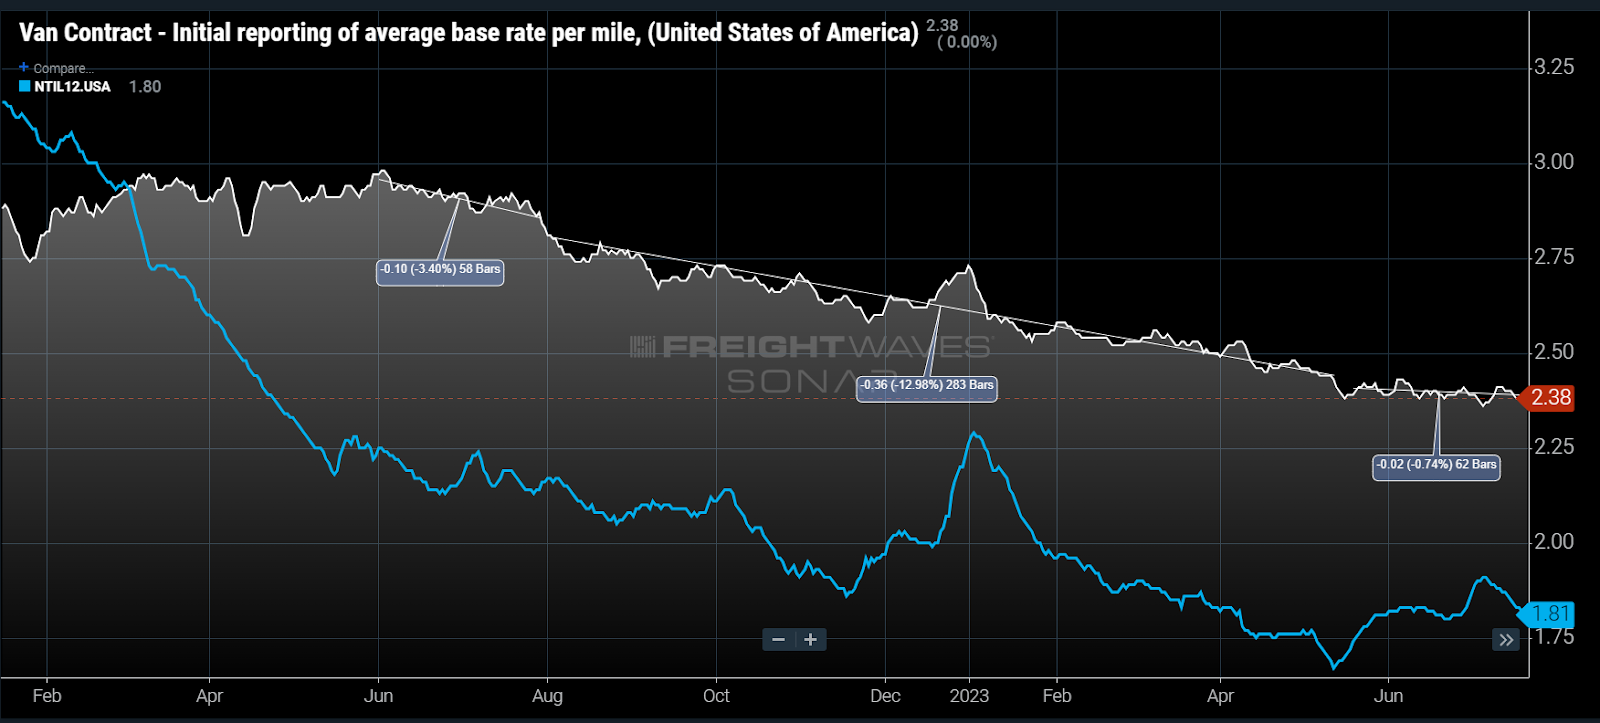
Chart of the Week: Van Contract Initial reporting of average base rate per mile, National Truckload Index excluding estimated fuel costs above $1.20/gal – USA SONAR: VCRPM1.USA, NTIL12.USA
Truckload dry van contract rates (VCRPM1) have flatlined over the past two months after dropping ~13% over the previous nine months. This is happening despite spot rates (NTIL12) still offering a 20% discount on average. Why is this happening?
Out of season
Traditional “bid season,” during which the bulk of the shippers send out RFPs for transportation providers to submit prices for their services for what is typically a year, occurs Q4 into Q1 of the following year. Implementation of the new rates tends to occur in Q1-Q2.
This means that contract rates typically stabilize through the middle of the year. For the period during and following the pandemic, contract rates have not had many periods of stability due to the enormous amount of volatility in demand creating a rapidly changing transportation market.
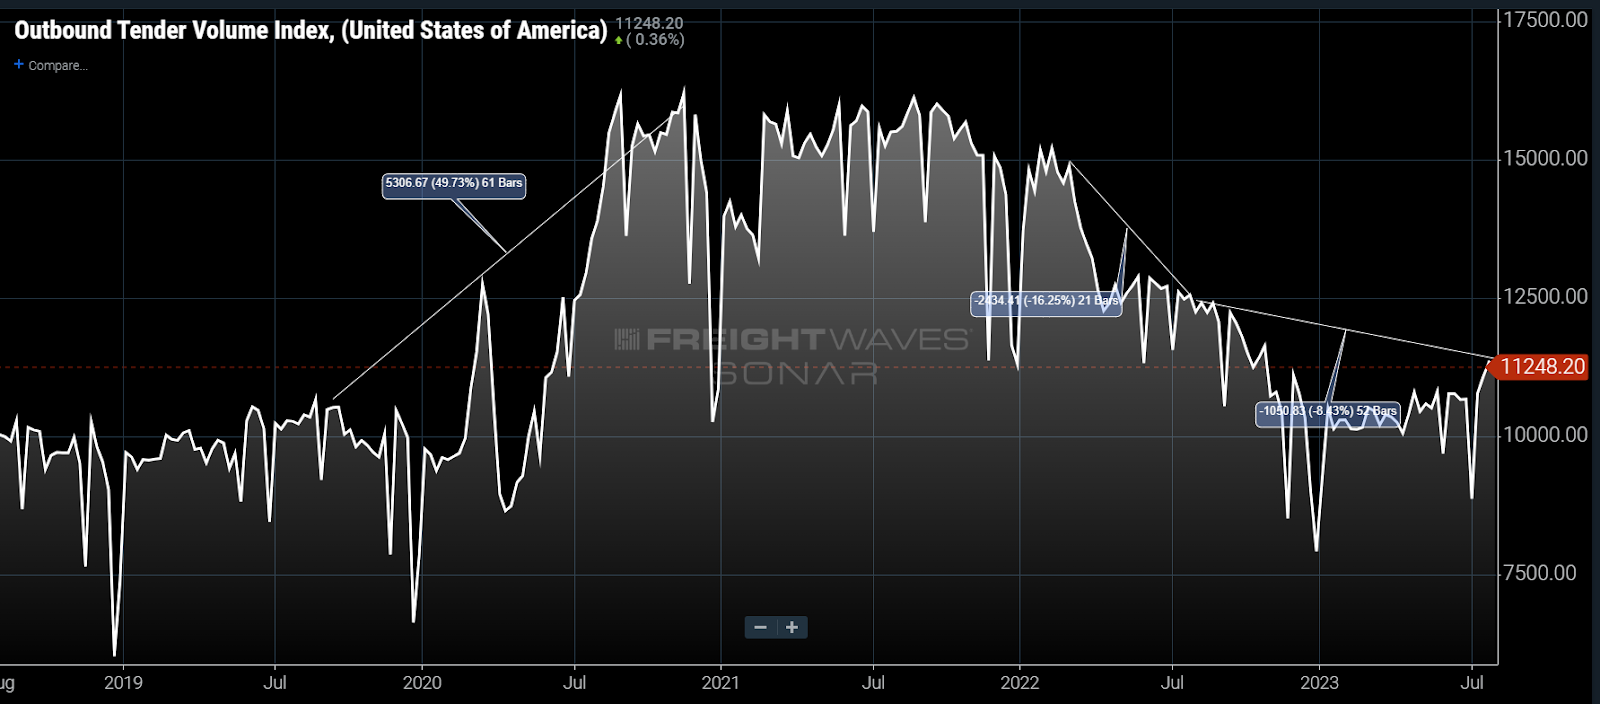
The national Outbound Tender Volume Index (OTVI), which measures shipper requests for contracted capacity, jumped ~50% from July 2019 to July 2020. The bulk of that jump came from April to July 2020. The OTVI fell 30% throughout 2022 as the pandemic-era consumption boom ended. Volume has been relatively stable in comparison through most of 2023.
Basically, the market has flipped from too much capacity to way too little and now way too much over the past four years. This has also disrupted the normal cadence of bidding.
Less negotiation
Many companies used mini-bids or put special project bids out on the market for carriers to bid for shorter periods of time just to ensure higher levels of service while capacity was tight. Once demand collapsed, some transportation providers offered early rate reductions prior to the bid to lock in rates and avoid exposure to the bulk of the market downturn.
Brokerages have leaned into their ability to be nimble and renegotiate as the capacity is in oversupply, taking advantage of their edge in a transitional market. Last summer, rates fell 4% from June to August. The current data shows this renegotiation cadence may be slowing.
Spot market stability
While spot rates excluding fuel costs above $1.20 per gallon (to make it comparable to a common fuel surcharge) are still averaging a 23% discount to the contract market, they are up approximately 4% off their spring average. Pair this increase with a jump in demand and there could be some market-level pressure arising from shippers being busier than expected, keeping them from reevaluating their current costs prior to their seasonal offering.
The bid process is very labor intensive and takes months for the largest shippers to prepare and execute. Shippers are getting the service they need with budgets also more than likely being in a good position as they were set on some level of pandemic-era cost assumptions.
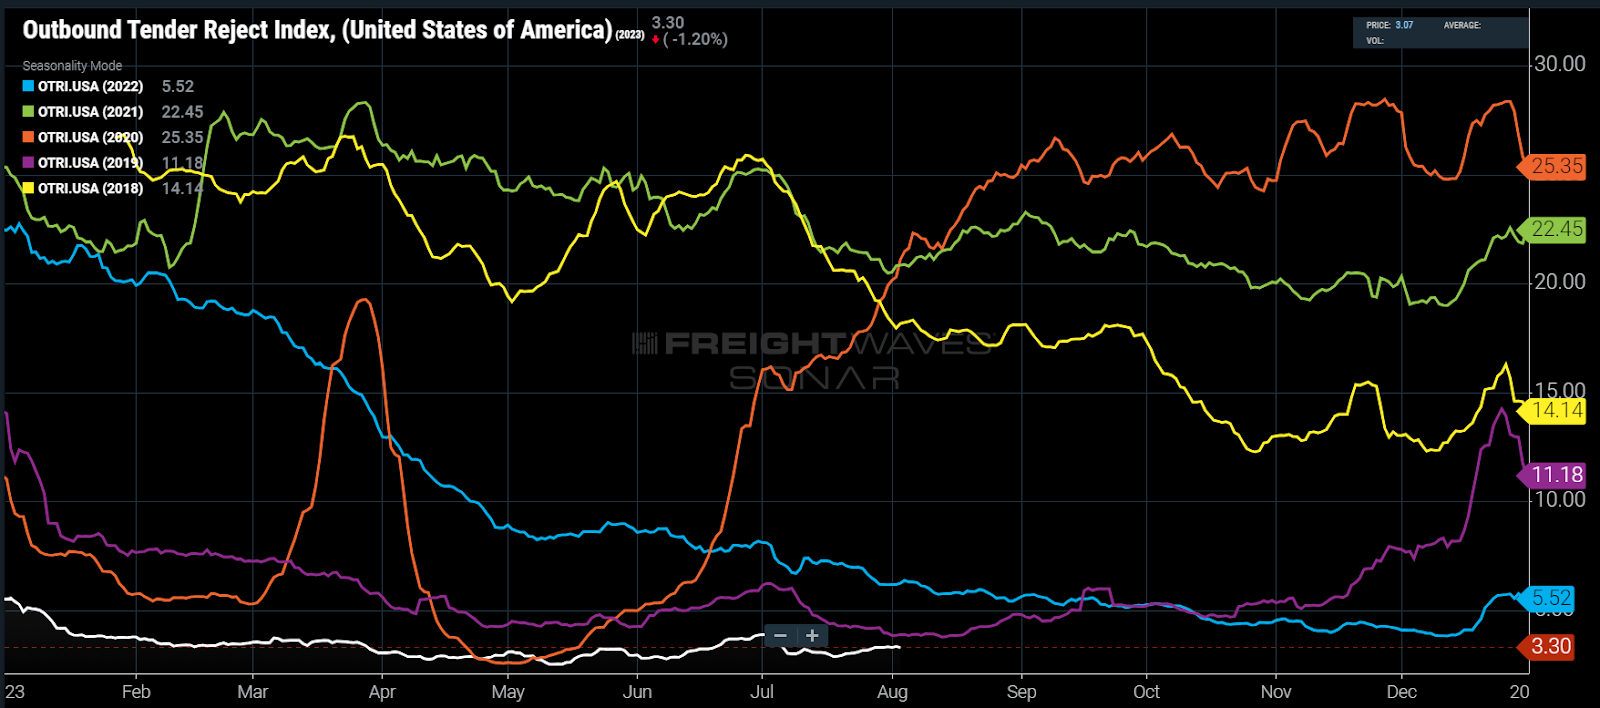
Tender rejection rates are still hovering around all-time lows for the summer. Unfortunately for transportation providers, this also means they are going to have to maintain an aggressive posture when competing for business during the upcoming bid season.
Service or price
Anecdotally, many companies have stated they are focused more on building a stable relationship with their transportation provider partners with a commitment to service. This is wise since consistent service saves much more money in the long run, though it is difficult to quantify when making an annual budget — especially when capacity is ample.
Companies will certainly be looking to get the most bang for their buck this upcoming bid season, but transportation managers are more aware than ever that market conditions can change rapidly and this environment of abundant capacity is not sustainable. This concept is difficult to sell to people outside of transportation (their bosses), meaning rates are more likely to resume at a faster pace of decline — which will only make them less reliable in the future.
About the Chart of the Week
The FreightWaves Chart of the Week is a chart selection from SONAR that provides an interesting data point to describe the state of the freight markets. A chart is chosen from thousands of potential charts on SONAR to help participants visualize the freight market in real time. Each week a Market Expert will post a chart, along with commentary, live on the front page. After that, the Chart of the Week will be archived on FreightWaves.com for future reference.
SONAR aggregates data from hundreds of sources, presenting the data in charts and maps and providing commentary on what freight market experts want to know about the industry in real time.
The FreightWaves data science and product teams are releasing new datasets each week and enhancing the client experience.
To request a SONAR demo, click here.
John Doe
Comments that are not in agreement with Freight waves broker favoring view are removed? I guess the desk’s in the ivory tower haul all the cargo…..not the carriers. When only 1 view is seen the wookies assume its the only view.
MEDIA STRIKES AGAIN. ( when will they learn their job is to report…..not make the news ) Statistics are after the fact but they can influence the future.
mrbigr504
🙄💩